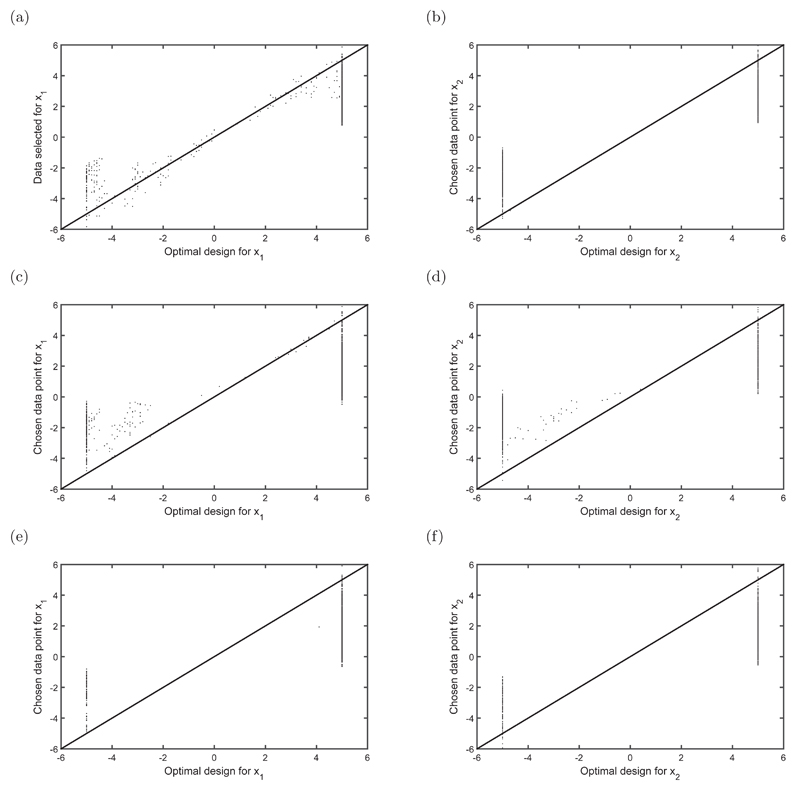
Fig 2.
Chosen designs for x1 and x2 vs optimal designs for x1 and x2 where the correlation structures for the covariates are: (a) and (b) no correlation between x1 and x2; (c) and (d) positive correlation between x1 and x2; (e) and (f) negative correlation between x1 and x2. The 45 degree line indicates where the selected data points for the subset are equal to the optimal design.

