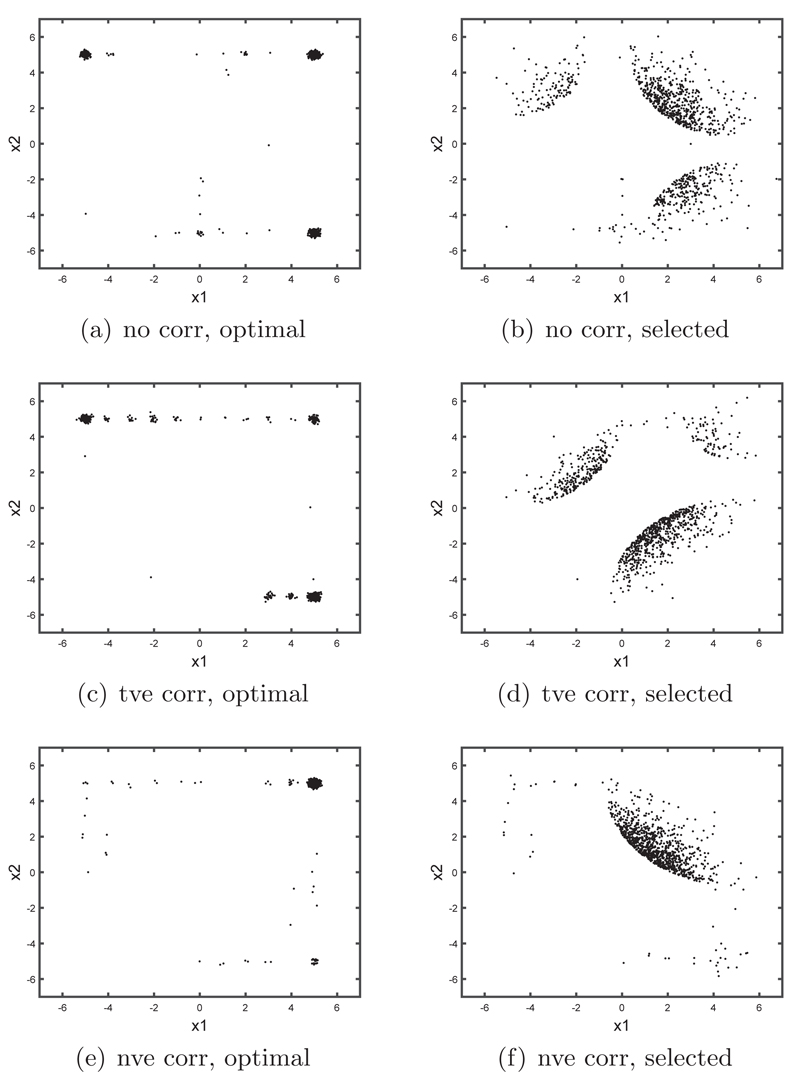
Fig 3.
Left hand column shows the optimal designs (with slight jittering) selected for one run of Algorithm 1 for the Bayesian logistic regression example. The right hand column shows the corresponding covariate values that were actually selected from the data. Results are shown for different covariance structures of X in the original (full) data: (top row) no correlation, (middle row) positive correlation, and (bottom row) negative correlation.

