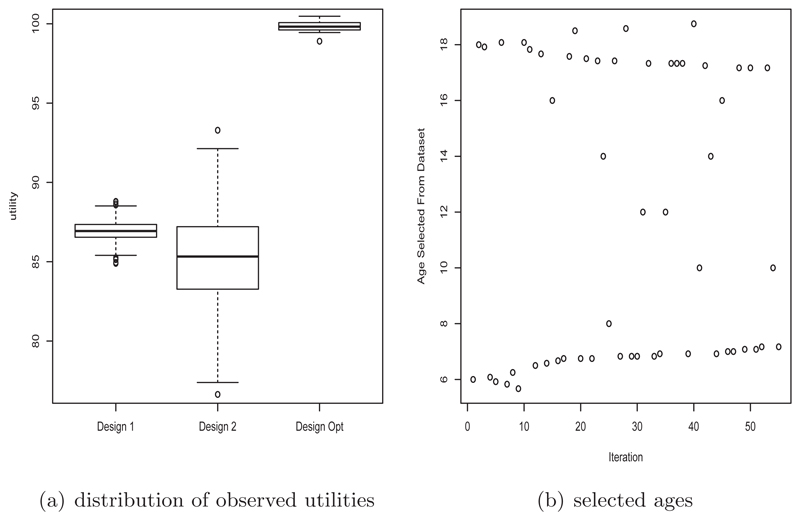
Fig 8.
Results from the sub-sampling optimal design process for the cut-point dataset. (a) Comparison of observed utilities of sub-samples obtained from designs 1 and 2 with the observed utilities of the sub-samples obtained from the optimal design process. (b) Ages selected from the dataset during the optimal design sub-sampling process.

