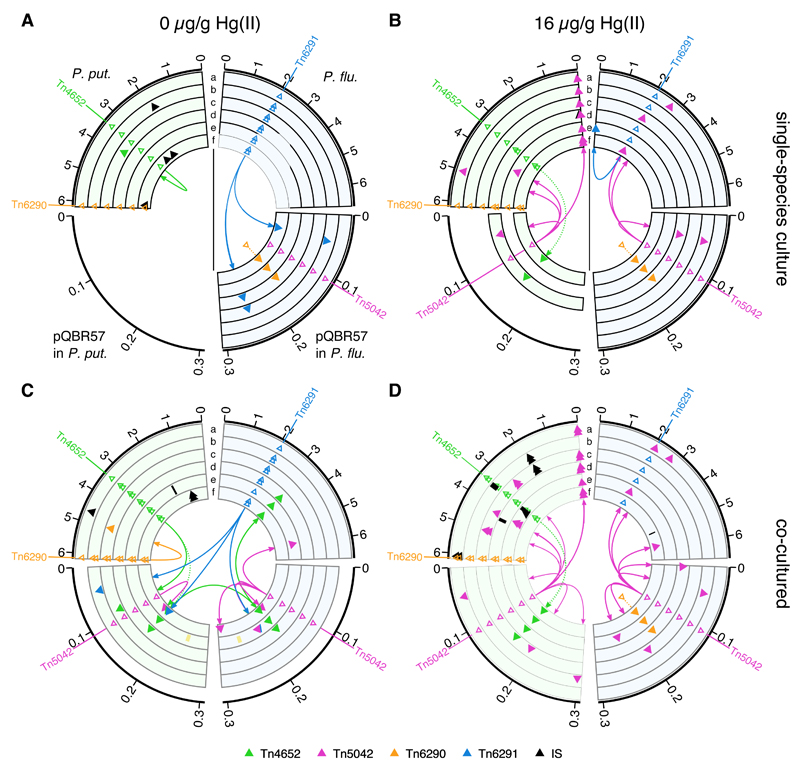
Figure 1.
Evolved clones show extensive within- and between-species gene mobilisation. Each panel shows events detected in evolved P. putida (left, light green) and P. fluorescens (right, light blue), with changes in associated pQBR57 (if present) shown below. In each panel, six concentric lanes a–f indicate independent populations. One clone was sequenced from each population for each species, except where both plasmid-bearing and plasmid-free genotypes were detected. In this case, we sequenced one clone of each, with the plasmid-bearing clone indicated by the inner set of symbols in that lane (Supplementary Table 1). Duplicative insertions of large TEs are indicated by filled triangles coloured according to TE type (see key) and connected to ancestral positions (indicated by open triangles) by an arrow describing direction of duplication. Dotted lines indicate insertions that occurred before the evolution experiment was initiated (see Methods). Insertions of smaller insertion sequence (IS) elements are in black. Black bars indicate large deletions, and yellow bars (panel C, replicate e) indicate large tandem duplications. Scale is given in Mbp, and replicons are scaled to the same size for clarity. (A) Clones evolved in single-species populations with 0 µg/g Hg(II). (B) Clones evolved in single-species population with 16 µg/g Hg(II). In panels A and B, lines indicate the physical separation of the two species. (C) Clones evolved in co-cultured populations with 0 µg/g Hg(II). (D) Clones evolved in co-cultured populations with 16 µg/g Hg(II).

