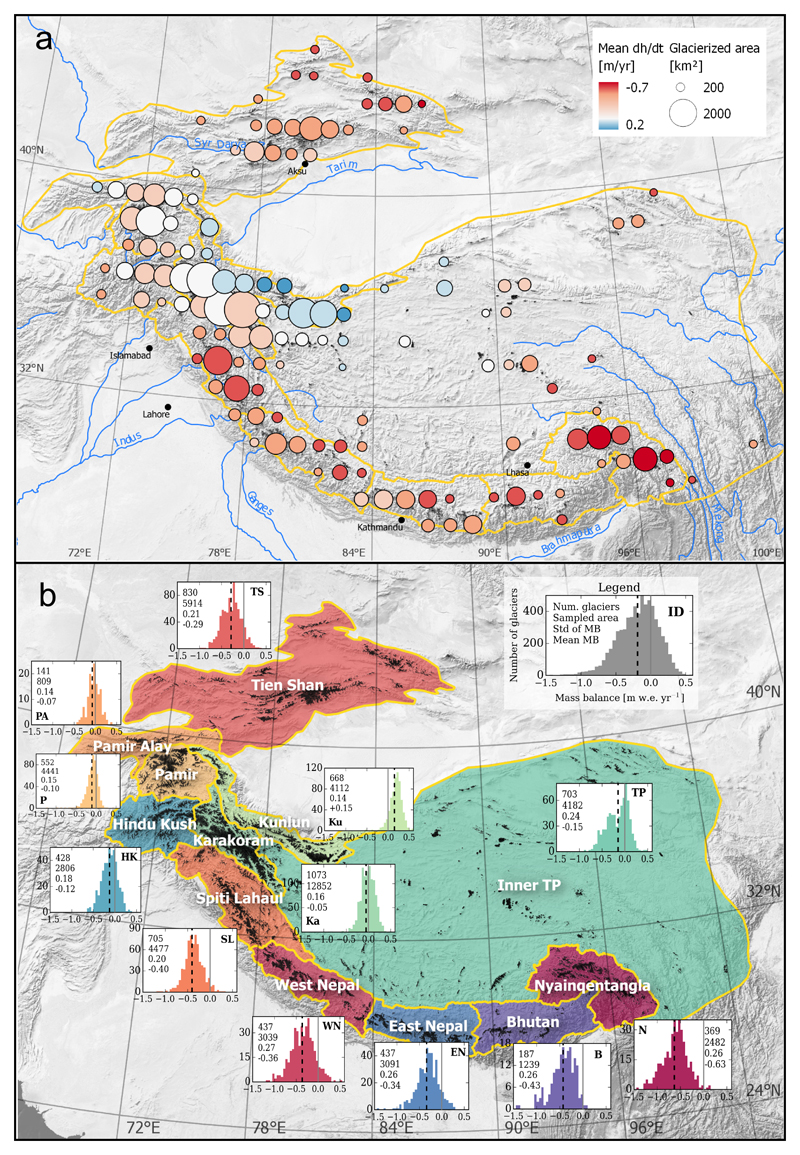
Figure 2. Glacier elevation changes and mass balance for High Mountain Asia (2000-2016).
a- map of glacier mean elevation change on a 1°×1° grid. b- For each region in ref. 4, the distribution of glacier-wide mass balance for every individual glacier (> 2 km2) is represented in histograms of the number of glaciers (y-axis) as a function of MB (x-axis in m w.e. yr-1). The black dashed line represents the area-weighted mean. The numbers denote the total number of individual glaciers (first), the corresponding total area (in km2, second), the standard deviation of their mass balances (in m w.e. yr-1, third) and the area weighted average mass balance (in m w.e. yr-1, fourth). Initials of the respective regions are repeated in bold in the graphs.

