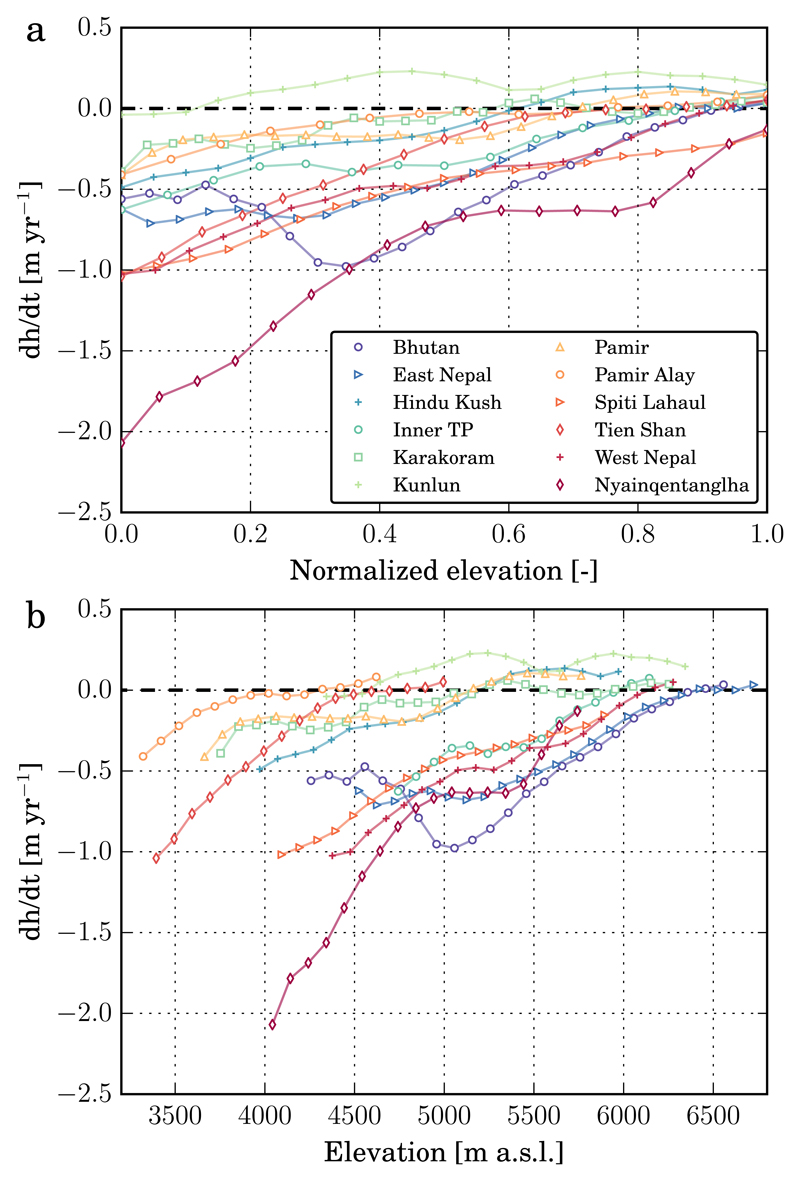
Figure 3. Altitudinal distribution of glacier elevation change.
a- Rate of elevation change for the period 2000-2016 as a function of normalized elevation, which is defined as (z - z2.5)/(z97.5-z2.5), where z is the elevation and z2.5 and z97.5 are the elevation of the 2.5 and 97.5 percentile of area, respectively. b- Rate of elevation change for the period 2000-2016 as a function of elevation (in m a.s.l.).

