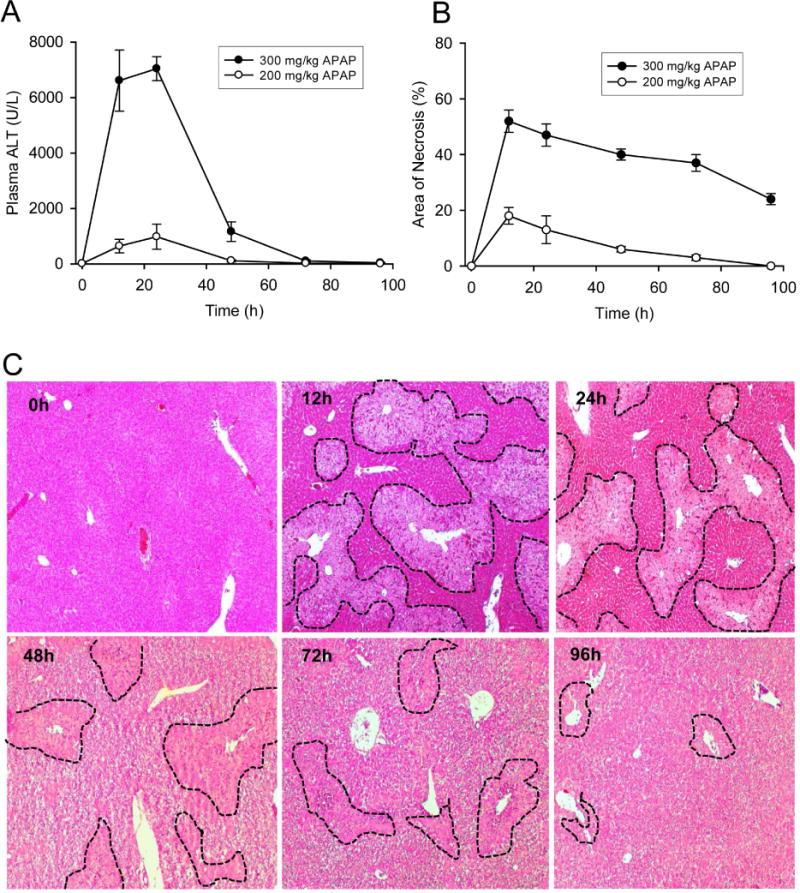
Figure 1. Time course and dose response of liver injury after acetaminophen treatment.

Mice were treated with 200 or 300 mg/kg acetaminophen (APAP) and sacrificed at various time points between 0 and 96h. (A) Plasma alanine aminotransferase (ALT) activity. (B) Areas of necrosis (%). (C) Representative H&E-stained liver sections (original magnification 50×) after 300 mg/kg APAP with necrotic areas outlined. Necrotic areas were identified by lack of nuclear staining or pyknotic nuclei and lines were marked along the boundaries. Data are expressed as mean ± SEM for n = 4–6 animals per group and time point.
