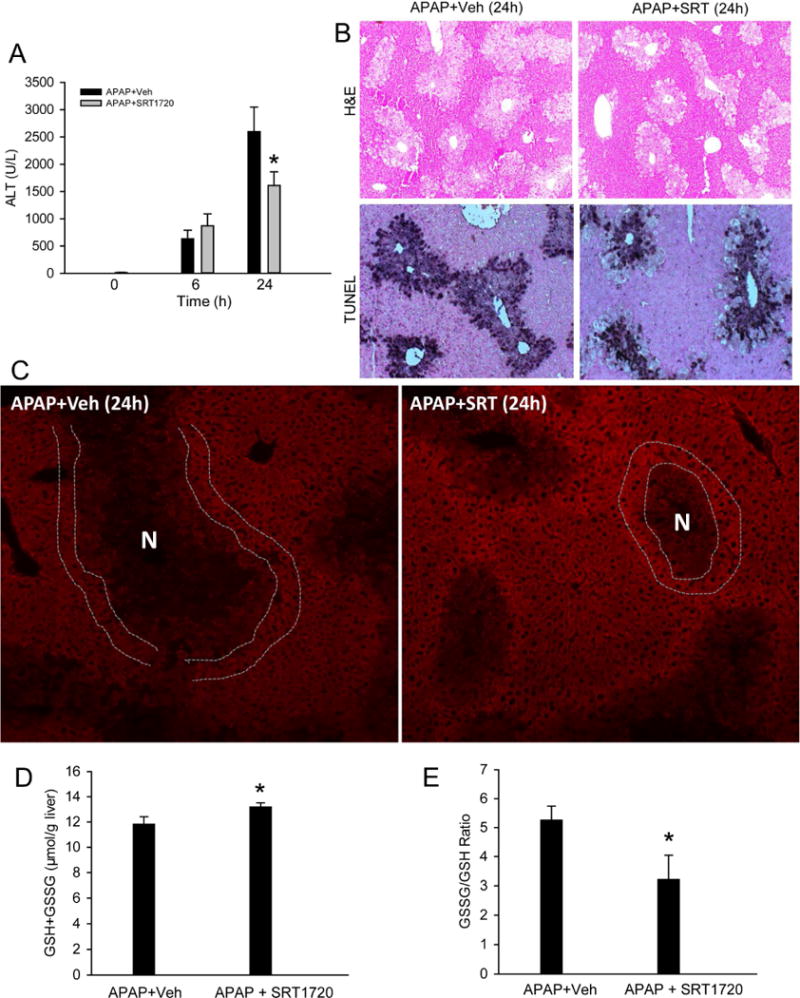
Figure 5. Induction of mitochondrial biogenesis protected against acetaminophen hepatotoxicity.

Mice were treated with 300 mg/kg acetaminophen (APAP) followed by 10 mg/kg SRT1720 or its vehicle 1.5h later, and sacrificed at 6h or 24h post-APAP. (A) Plasma alanine aminotransferase (ALT) activity. (B) H&E- or TUNEL-stained liver sections at 24h (Original magnification 50×). (C) Immunofluorescent staining of Tom20 (red) in liver tissue at 24h (Original magnification 100×). Necrotic areas were identified by lack of nuclear staining or pyknotic nuclei in corresponding DAPI images and marked as indicated. Double white lines highlight cells with enhanced Tom20 staining around the necrotic area. (D) Total GSH levels and (E) GSSG/GSH ratio at 24h. All measurements were carried out as described in the materials and methods section. Data are expressed as mean ± SEM for n = 4–6 animals per group and time point. *P< 0.05 vs. APAP+Veh.
