Figure 1.

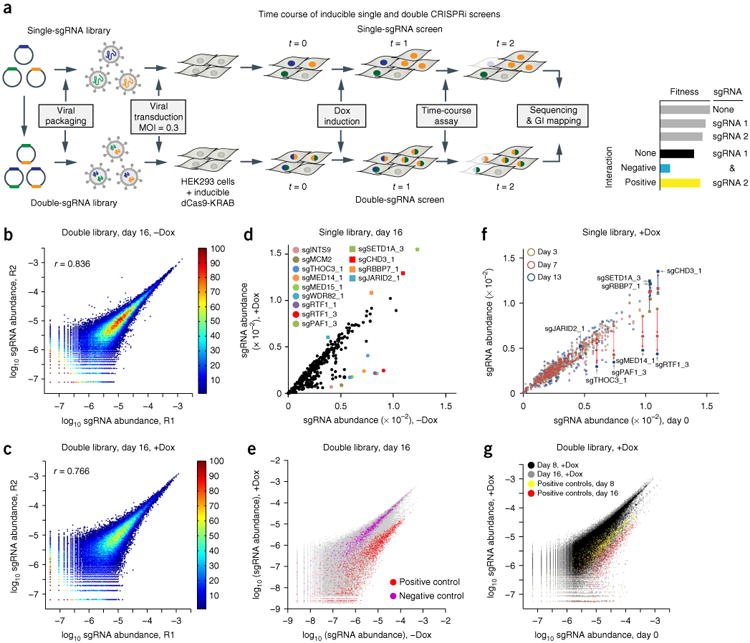
The CRISPRi screening platform for studying genetic interactions. (a) The experimental platform for single and double CRISPRi screening for GI studies. MOI, multiplicity of infection; t, time. (b,c) Characterization of independent experimental replicates for double-sgRNA libraries (R1 and R2, two independent experimental replicates). Double library without Dox (−Dox) at day 16 (b) or with Dox (+Dox) at day 16 (c). The correlation coefficient (r) for each comparison is displayed. The color bar shows the density of data. (d) Comparison of the single library with or without Dox at day 16. The colored dots show representative depleted sgRNAs, and squares show the enriched sgRNAs in the pool. (e) Comparison of the double library with or without Dox at day 16, with all data in gray and pairs containing positive (red) and negative (purple) control sgRNAs. (f) Comparison of day 0 with other time points (yellow, day 3; red, day 7; blue, day 13) in the presence of Dox for the single library. Consistent depletion and enrichment of representative sgRNAs are indicated with red and blue arrows, respectively. The comparison without Dox is shown in Supplementary Figure 4j. (g) Comparison of day 0 with other time points (black, all sgRNAs in the day 8 sample; yellow, all pairs containing positive-control sgRNAs in the day 8 sample; gray, all sgRNAs in the day 16 sample; red, all pairs containing positive-control sgRNAs in the day 16 sample) in the presence of Dox for the double library. The comparison without Dox is shown in Supplementary Figure 4k.
