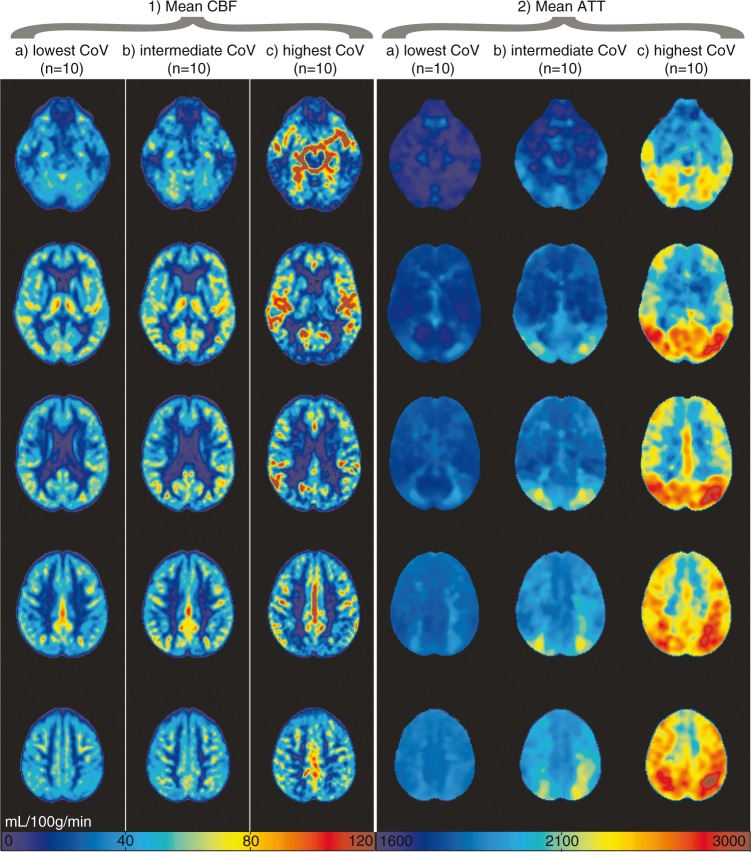
Figure 2.
Mean non-crushed cerebral blood flow (CBF) (1) and arterial transit time (ATT) (2) images are shown for the 10 participants with lowest (a, 39.3%–41.6%), intermediate (b, 52.8%–54.8%) and highest (c, 83.4%–113.6%) spatial coefficient of variance (CoV), respectively. CBF was rescaled per participant to a mean gray matter CBF of 50 mL/100 g/min for this figure.

