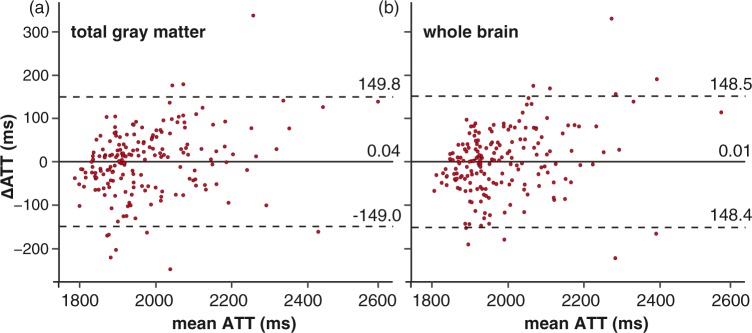
Figure 3.
Bland–Altman plots of the difference between ATT measured by flow encoding arterial spin tagging (FEAST) and ATT predicted from the spatial coefficient of variance (CoV) by the leave-one-out cross-validation, plotted against the mean of both ATTs for the total gray matter region-of-interest (ROI) (a) and the whole brain ROI (b). ATT: arterial transit time; FEAST: flow encoded arterial spin tagging. Continuous and broken lines indicate mean difference and limits of agreement (mean difference ± 1.96 standard deviation of the paired difference), respectively.

