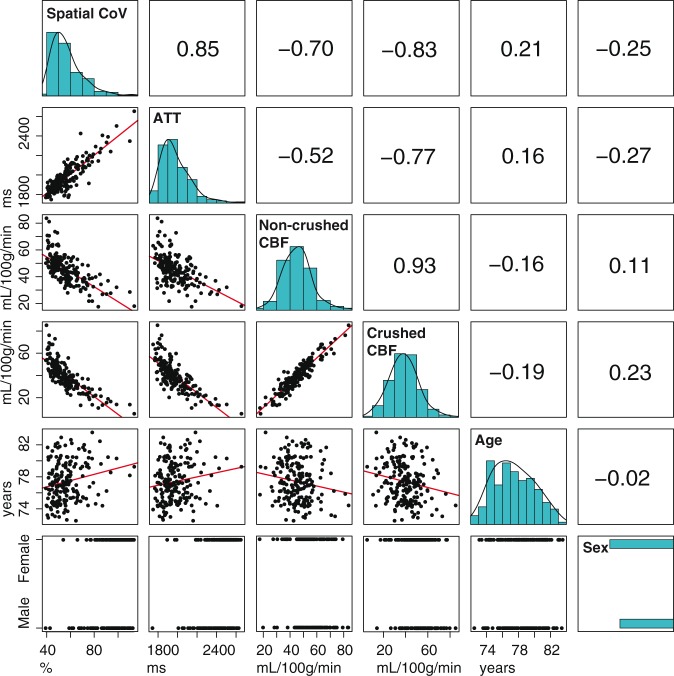
Figure 4.
Table containing bivariate Pearson associations for spatial coefficient of variation (CoV), arterial transit time (ATT), non-crushed and crushed cerebral blood flow (CBF). The diagonal shows histograms in turquoise. Bivariate scatter plots (black) and linear regression lines (red) are shown in the table elements below the diagonal, whereas Pearson coefficients are shown above the diagonal. Histograms are shown without data transformation, whereas the associations with spatial CoV or ATT were performed with their log-transformed values.

