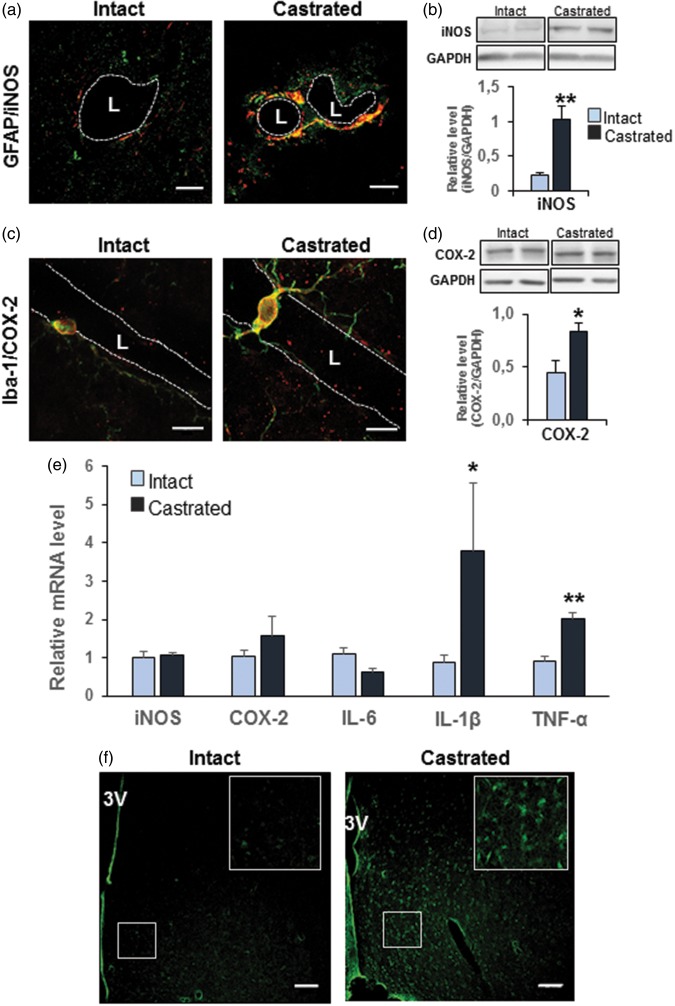
Figure 5.
Depletion of gonadal testosterone induced inflammatory molecules. (a) Representative images of co-immuno-detection of iNOS (red) and GFAP (green) performed in three independent experiments per group in the MPOA of intact (left panel) and castrated mice (right panel). iNOS labeling colocalized with GFAP labeling (yellow) surrounding capillaries of castrated mice corresponding to perivascular astrocytes end-feet. Scale bar = 10 µm, n = 3 per group. (b) Western blot analysis performed on microvessel-enriched fractions showing iNOS amount in castrated mice compared with age-matched intact mice. Data were normalized to GAPDH level. Values represent means ± SEM **p ≤ 0.01 compared to the intact group (n = four to five mice per group). (c) Representative images of co-immuno-detection of COX-2 (red) and Iba-1 (green) in the MPOA of intact (left panel) and castrated mice (right panel). COX-2 and Iba-1 were co-localized (yellow), and the labeling appeared more intense in cells surrounding capillaries. Scale bar = 10 µm, n = 3 per group. (d) Western blot analysis performed on microvessel-enriched fractions showing COX-2 amount in castrated mice compared with age-matched intact mice. Data were normalized for GAPDH level. Values represent means ± SEM *p ≤ 0.05 compared to the intact group (n = four to five mice per group). (e) Quantitative analysis by qRT-PCR of transcript levels of iNOS, COX-2, Il-6, IL-1β, and TNF in capillary-enriched fractions of five weeks castrated mice compared with their controls. Data were normalized to HPRT levels. *p ≤ 0.05 and **p ≤ 0.01 compared to the intact group (n = four mice per group). (f) Representative labeling of MPOA sections with Fluoro-Jade® C in intact (left panel) and castrated mice (right panel). Scale bar: 80 µm, n = 2 per group.
L: Lumen; 3V: third ventricle.

