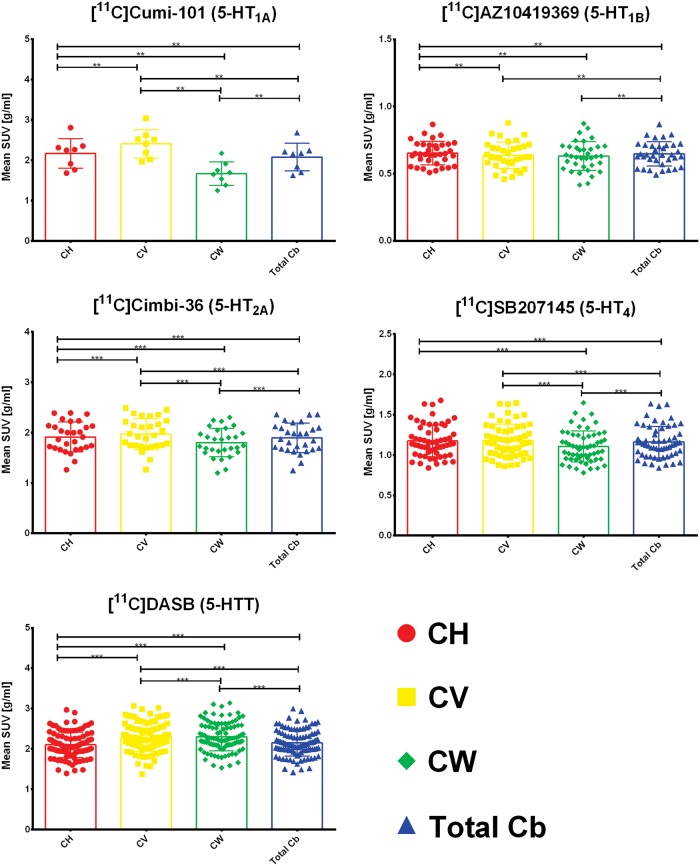
Figure 2.
Differences in meanSUV for the four regions – cerebellar gray matter in the hemispheres (CH), cerebellar vermis (CV), cerebellar white matter (CW), and total cerebellum (total cb). The box plot displays the mean, the whiskers extend to ± one standard deviation, and all values are plotted as dots individually. Significance of within subjects, paired nonparametric two-sided Wilcoxon signed-rank tests is given by *p < 0.05, **p < 0.01, ***p < 0.001 after correction for multiple comparisons via false discovery rate (FDR) < 0.05.

