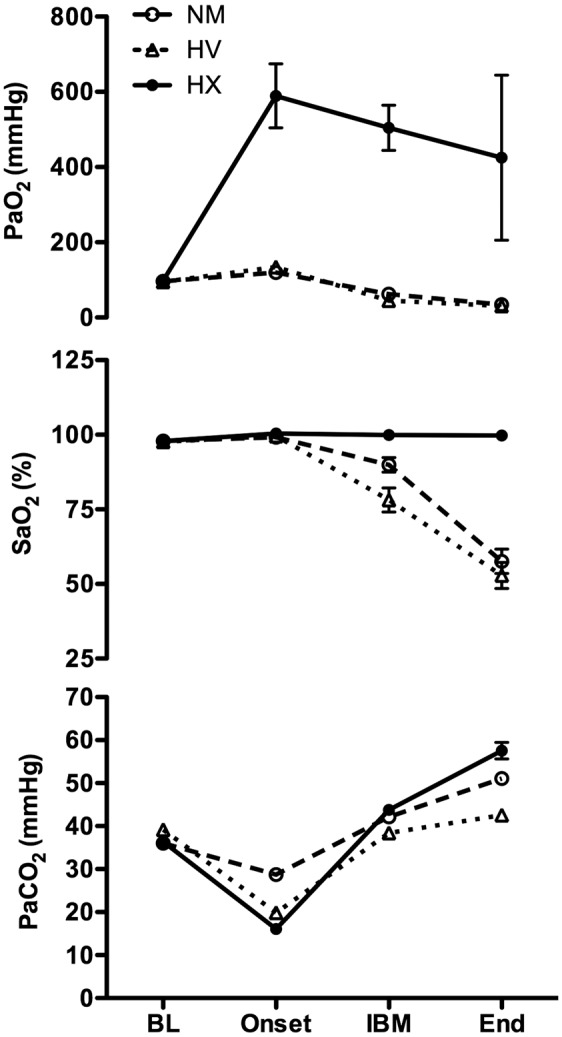
Figure 5.

Arterial partial pressure of O2 (PaO2; top panel), arterial oxygen saturation (SaO2; middle panel), and the partial pressure of arterial CO2 (PaCO2; bottom panel) for all three apneas at baseline (BL), the apnea onset (Onset), the first involuntary breathing movement (IBM), and immediately at the termination of apnea (End). Error bars denote 95% confidence intervals. By design, there was a significant main effect of condition, time, and time*condition for all variables. There were no differences at baseline for any variable between conditions. See text for exact post hoc statistical analysis.
