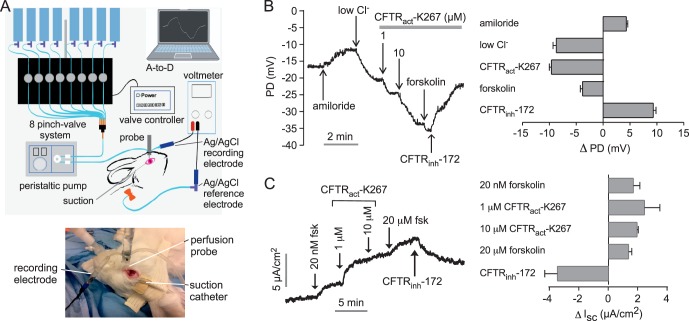
Figure 2.
Electrophysiological analysis of CFTR activation by CFTRact-K267 at the rabbit ocular surface. (A) Schematic (top) and photograph (bottom) of ocular surface potential difference (PD) recording method. The perfusion catheter coupled to the measuring electrode was oriented perpendicular to the ocular surface near the medial canthus. The eyelids create a natural reservoir for corneal and conjunctival exposure, with vacuum aspiration maintaining a stable perfusate volume. (B) Left: Representative ocular surface PD recording in response to sequential solution exchanges. Right: Summary of PD changes (Δ PD) in response to indicated maneuvers (mean ± SEM; n = 16 eyes). (C) Left: Representative short-circuit current (Isc) measurement in freshly isolated rabbit forniceal and palpebral conjunctiva in response to compound additions. Right: Summary of changes in Isc (Δ Isc) in response to compound additions (mean ± SEM; n = 3).

