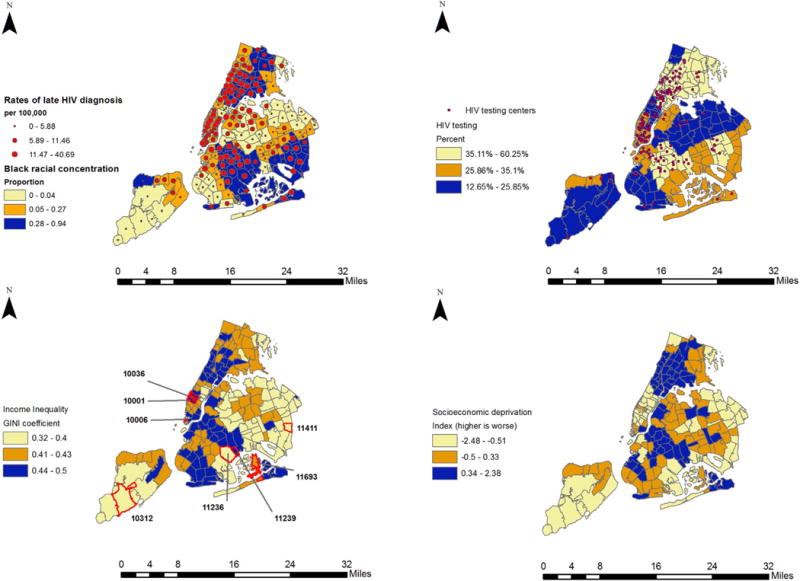
Fig. 3.

Choropleth maps (from top left to right) of Black racial concentration overlaid with late HIV diagnosis rates, HIV testing prevalence overlaid with location of HIV testing centers, income inequality, and socioeconomic deprivation index across, NYC ZIP codes (n=174). Selected ZIP codes on the income inequality map correspond to those in Fig. 2 and Supplement Table 1.
