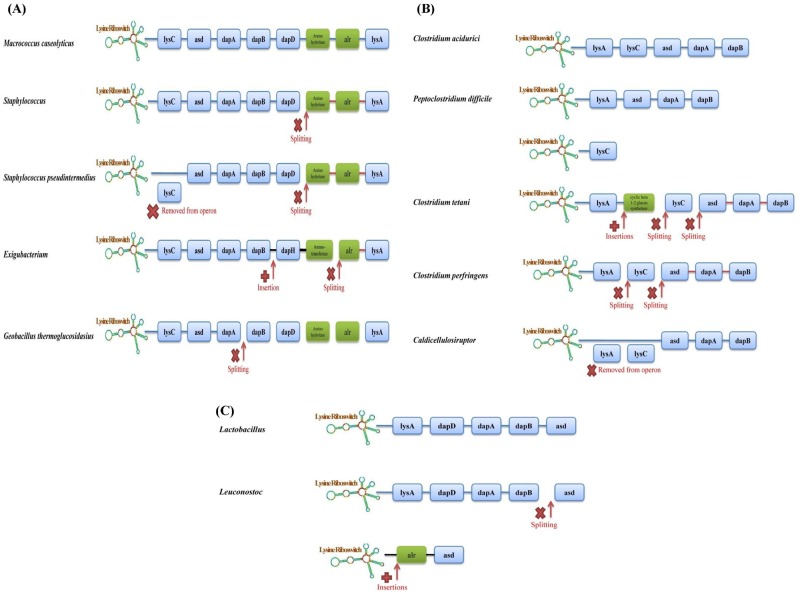
Fig 3. Genome rearrangement and operon organizations in (A) Bacillales (B) Clostridiales and (C) Lactobacillales.
Blue and green filled rectangles represent lysine biosynthesis genes and those genes that are not involved in lysine biosynthesis, respectively. Red cross marks locations where an operon has split or a gene has been removed from an operon. A red plus sign marks location where one or more genes have been inserted into the operon. For cases where only the genus name is provided, all the species of that genus have the same operon structure.

