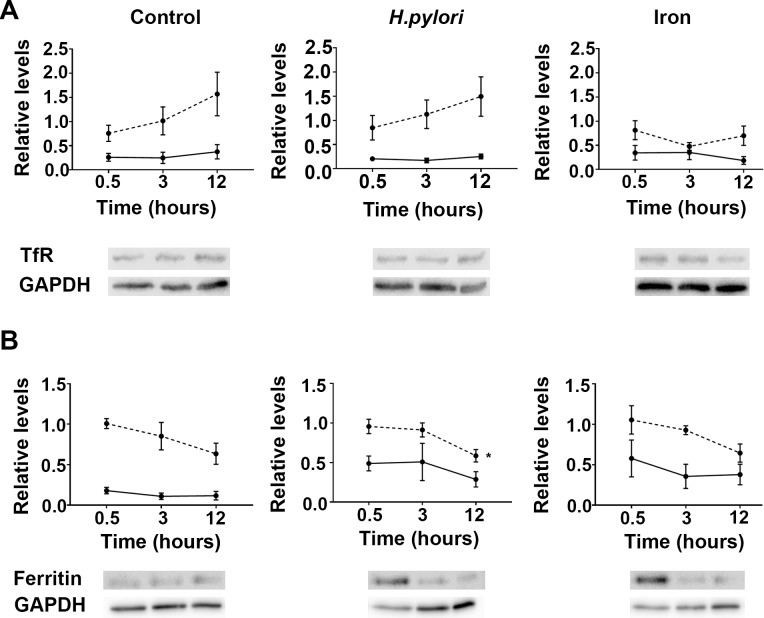
Fig 1. Quantification of transferrin receptor mRNA and protein in AGS cells infected with H. pylori.
Cells were infected with wild type H. pylori strain 60190 (MOI, 10:1) or supplemented with 100 μm iron sulphate, with (A) transferrin receptor (TfR) and (B) H-ferritin mRNA (dotted line) and protein levels (solid line) quantitated throughout 12 h of infection. Levels are expressed as the amount of RNA and protein relative to endogenous controls HPRT and GAPDH, respectively, with representative immunoblots shown below the graphs. Data points for mRNA levels represent the average of three experiments each done in triplicate, whereas data points for protein represent ±SEMs for three independent immunoblotting experiments. *, levels over time are statistically different (P<0.05), as determined by one-way ANOVA with Tukey’s test for multiple comparisons.

