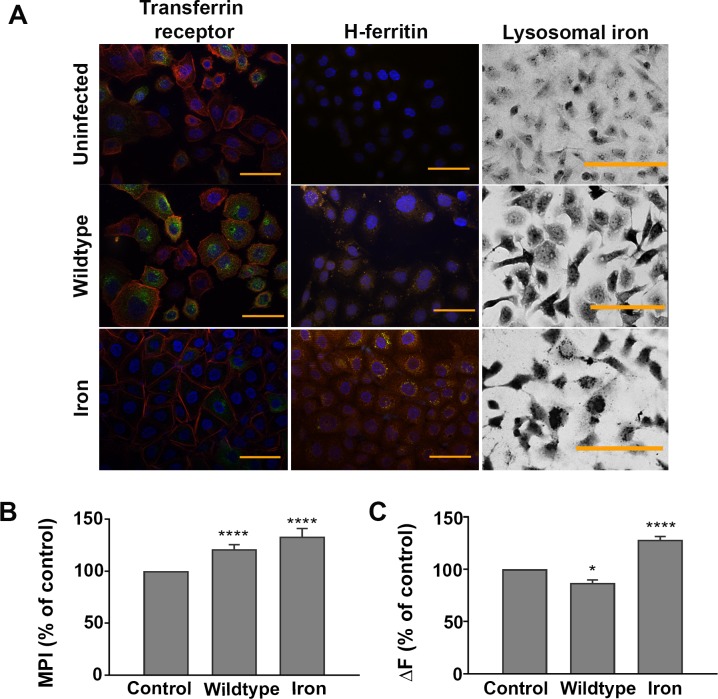
Fig 2. Distribution of transferrin receptor and H-ferritin in H. pylori-infected AGS cells.
AGS cells infected with H. pylori strain 60190 (MOI, 10:1) or supplemented with iron sulphate (100 μm) for 15 h were fixed and stained with Alexa Fluor 488-labelled transferrin receptor (green), Texas Red-conjugated phalloidin-stained actin (red) and Hoechst 33342-stained nuclei (blue) in non-permeabilized cells; Streptavidin-Phycoerythrin-stained H-ferritin (orange) and Hoechst 33342-stained nuclei (blue) in Triton X-100 permeabilized cells, and lysosomal iron using sulphide-silver (left, middle and right columns, respectively). The images, which are representative of three independent experiments, denote cells with no bacteria (Uninfected), infected with H. pylori strain 60190 (Wildtype) or supplemented with 100 μm iron sulphate (Iron) for 15 h. All images were taken with the same exposure time for each channel. Bar = 50μm. (B) The mean pixel intensity (MPI) of sulphide-silver stained AGS cells following infection with H. pylori or supplemented with iron sulphate calculated using ImageJ software, with levels of lysosomal iron (evidenced by MPI) expressed as a percentage of that observed in uninfected (Ctrl) cells. (C) H. pylori-infected and iron-supplemented AGS cells treated with calcein, with and without the addition of SIH to measure the cytosolic labile iron pool. Results, which show an increase in fluorescence (ΔF) in infected and iron-supplemented cells, are presented as a percentage of uninfected cells. (B) Results are ± SEM of five images taken from three independent experiments and (C), ± SEM of 3 independent repeats. *, ****, results are statistically different from those of untreated controls (P<0.05 and <0.0001, respectively), as determined by one-way ANOVA with Tukey’s test for multiple comparisons.

