Figure 3.

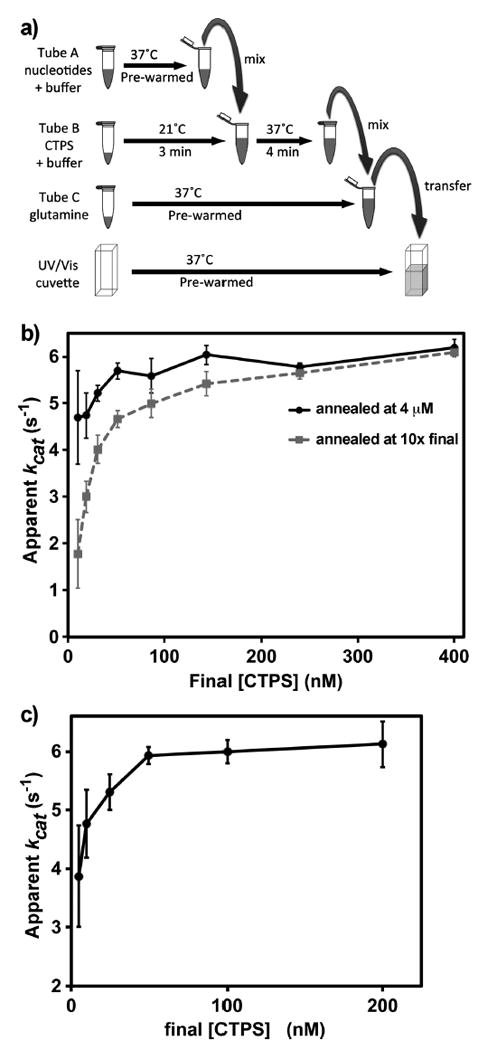
In vitro EcCTPS reactions. (a) Scheme for performing EcCTPS reactions. EcCTPS enzyme (2–40 μM) was annealed for 3 min at 21 °C in reaction buffer then mixed with prewarmed nucleotide substrates and effectors and incubated for an additional 4 min at 37 °C. To initiate the synthesis reaction, the enzyme–nucleotide solutions were mixed with 10-fold concentrated 37 °C glutamine solution and immediately transferred to 37 °C cuvettes to measure the change in UV absorbance at 291 nm. (b) Concentration dependence of the annealing reaction on specific activity (apparent kcat). Different amounts of EcCTPS were annealed at either 4 μM (black circles) or at 10-fold final concentration (100–4000 nM, gray squares) EcCTPS prior to dilution to 10–400 nM into nucleotides and glutamine as described in panel a and Materials and Methods. Note that the apparent kcat values for the two curves converge between 2 and 2.4 μM. (c) Dependence of apparent kcat values on final [EcCTPS] in the reaction. In a separate experiment from panel b, 4 μM EcCTPS was preincubated at 21 °C, then diluted to the final concentrations indicated on the horizontal axis (5–200 nM) upon addition of nucleotides and glutamine as described in panel a and Materials and Methods. Under these conditions, kcat increases approximately 5–9% going from 100 to 500 nM final EcCTPS (Figure S8).
