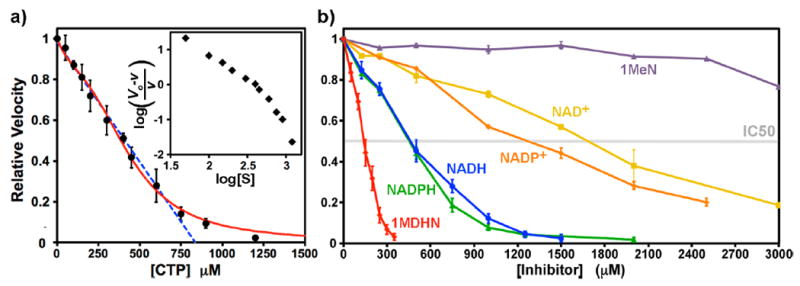
Figure 4.

(a) Dose–response curve for CTP inhibition. Data points are indicated (black circles) as the averages of three, six, or nine separate determinations. The error bars indicate ±SD. The dose response is nearly linear up to 750 μM CTP (blue dashed line, R = 0.993). The best-fit curve to a four-site sequential binding model is also shown (red curve, see Materials and Methods). The parameters K1, K2, K3, and K4 were 446, 2120, 1173, and 7.5 μM, respectively. The fit IC50 value is 385 μM. A Hill plot is shown in the inset. The limiting slopes at low and high CTP concentrations are −1.5 and −4.0, respectively, and the average slope is −2.0. (b) Dose-dependent EcCTPS inhibition by various reduced and oxidized nicotinamide compounds. Each line is labeled and color-coded for the particular compound (see Figure 2). Reactions were performed under standard conditions (see Materials and Methods), with inhibitors present during the nucleotide preincubation period (see Figure 3). Numeric IC50 values are found in Table 2.
