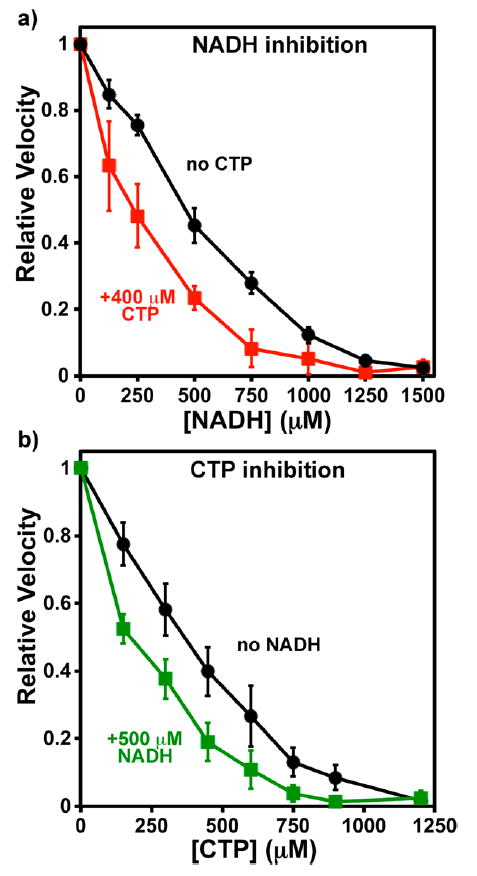
Figure 5.

Interactions between NADH and CTP. Error bars indicate the standard deviation of the indicated number of experiments after normalizing to V0 equal to one. IC50 values are given in Table 3. (a) Relative CTP synthesis velocities with 0–1500 μM NADH in the absence (black circles) or presence (red squares) of 400 μM CTP. The average V0 values were 1.23 ± 0.05 (n = 6) and 0.61 ± 0.05 μM s−1 (n = 4), respectively. (b) Relative velocities with 0–1200 μM CTP in the absence (black circles) or presence (green squares) of 500 μM NADH. The average V0 values were 1.31 ± 0.30 (n = 6) and 0.66 ± 0.01 μM s−1 (n = 4), respectively.
