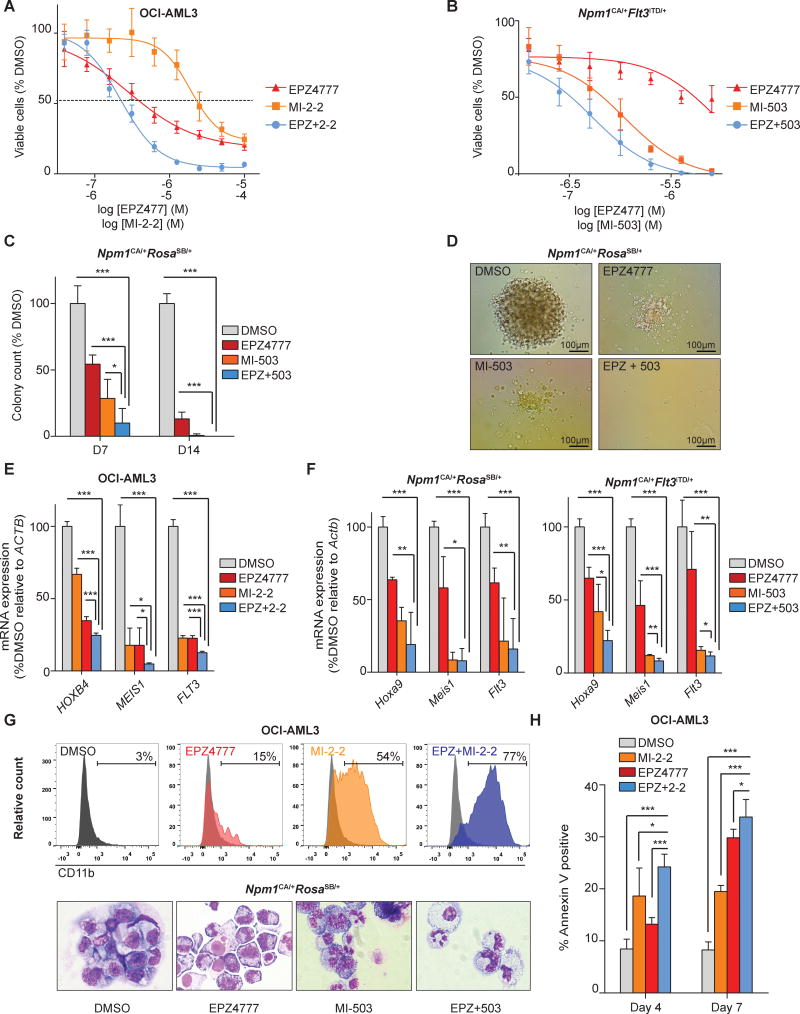
Figure 6. Effects of combinatorial menin-MLL11-i and DOT1L-i in murine and NPM1mut leukemia cells.
(A) Dose response curves from cell viability assays of OCI-AML3 cells comparing 7 days of MI-2-2 [12μM], EPZ4777 [10μM], and combinatorial EPZ4777 [10μM] and MI-2-2 [12μM] (EPZ+2-2) treatment.
(B) Dose response curves from cell viability assays of Npm1CA/+Flt3ITD/+ leukemia cells comparing 11 days of MI-503 [2.5μM], EPZ4777 [10μM], or combinatorial EPZ4777 [10μM] and MI-503 [2.5μM] (EPZ + 503) treatment.
(C) Comparison of MI-503 [2.5μM], EPZ4777 [10μM], and combinatorial MI-503 [2.5μM] and EPZ4777 [10μM] treatment of murine Npm1CA/+RosaSB/+ leukemia cells in colony-forming assays assessed on day 7 (D7) and day 14 (D14) of treatment.
(D) Representative colony formation of Npm1CA/+RosaSB/+ leukemia cells following 7 days of EPZ4777 [10μM], MI-503 [2.5μM] or combinatorial EPZ4777 and MI-503 treatment.
(E) Gene expression changes of selected leukemogenic genes in human OCI-AML3 following 4 days of EPZ4777 [10μM], MI-2-2 [12μM] or combinatorial EPZ4777 and MI-2-2 treatment as assessed by quantitative PCR.
(F) Expression changes of Hoxa9, Meis1, and Flt3 in murine Npm1CA/+RosaSB/+ (left panel) and Npm1CA/+Flt3ITD/+ leukemia cells (right panel) following 4 days of EPZ4777 (10μM), MI-503 (2.5μM) or combinatorial EPZ4777 and MI-503 treatment as assessed by quantitative PCR.
(G) Cell differentiation of NPM1mut leukemia cells as assessed by flow cytometric analysis of CD11b in OCI-AML3 cells (upper panel) and cytology of Npm1CA/+ RosaSB/+ leukemia cells (lower panel). Representative pictures are shown in the lower panel and data were obtained after 4 days of treatment (EPZ4777: [10μM], MI-2-2: [12μM], MI-503: [2.5μM]).
(H) Apoptosis in OCI-AML3 cells following 4 days of EPZ4777 [10μM], MI-2-2 [12μM] or combinatorial EPZ4777 [10μM] and MI-2-2 [12μM] treatment as assessed by flow-cytometric staining for Annexin V.
Data represent averages of two independent experiments, each performed in three replicates (A, B, C, E, F, G, H). Error bars represent the SEM.

