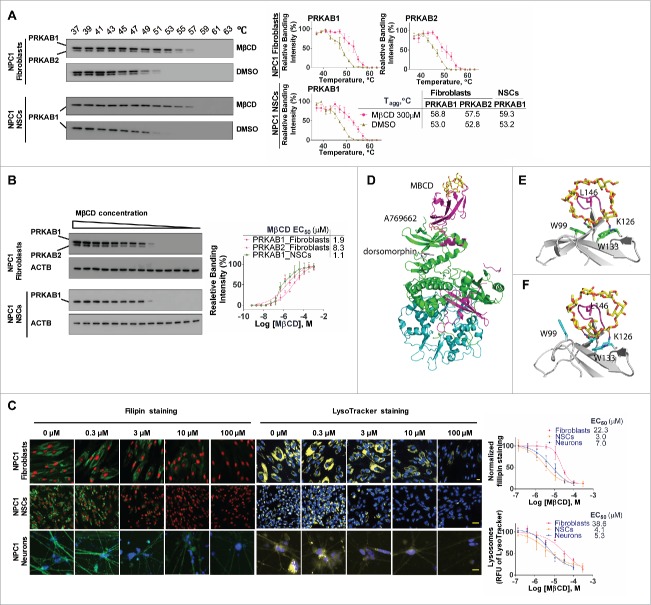
Figure 4.
MβCD binds to PRKAB1 and PRKAB2 with a higher affinity for PRKAB1. (A) Temperature melting curves of PRKAB1 and PRKAB2 in the presence or absence of 300 µM MβCD. The relative chemiluminescent intensity of each sample at different temperatures was used to generate temperature-dependent melting curves and the apparent aggregation temperature (Tagg) was calculated by nonlinear regression. (B) Apparent binding affinities of MβCD with PRKAB1 and PRKAB2 measured by CETSA. Cell lysates were treated with MβCD and heated to 53°C for 3 min. The supernatants obtained after centrifugation were analyzed by western blotting using anti-PRKAB1 or anti-PRKAB2 antibody. A representative blot was shown and data represent mean ± SEM of at least 3 replicates. (C) MβCD reduced NPC1 phenotypes in fibroblasts, NSCs and neurons. NPC1 cells were cultured in 96-well plates and treated with various concentrations of MβCD. After a 4-d (fibroblasts and NSCs) or 3-d (neurons) incubation filipin or LysoTracker Red staining was performed. Data represent mean ± SEM of 3 replicates. (D) A structural model of AMPK (PRKAA2B1G1, PDB code 4CFF) bound with MβCD (yellow), activator A769662 (brown), and inhibitor dorsomorphin (gray). The 3 subunits of AMPK are shown in green (PRKA2), magenta (PRKAB1), and cyan (PRKAG1). (E) Binding model of MβCD with PRKAB1. (F) Binding model of MβCD with PRKAB2. MβCD is shown in sticks in yellow (carbon atom). AMPK is shown in ribbons and key interacting residues are shown in sticks in green (PRKAB1) or cyan (PRKAB2). Residue L146 within a flexible loop, which is positioned in the MβCD hole, is shown in magenta.

