
Figure 5.
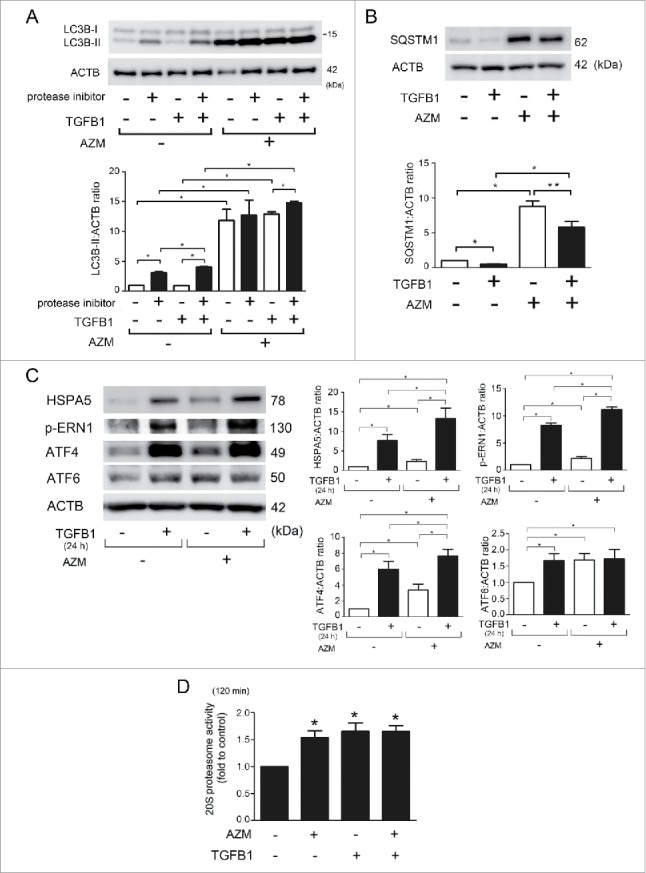
Effect of AZM on TGFB-induced autophagy and TGFB-mediated UPR and proteasome activation in LF. (A) WB using anti-LC3 and anti-ACTB of cell lysates from control (lane 1, 2), TGFB1-treated (lane 3, 4, 7, 8) and AZM-treated (lane 5, 6, 7, 8) LF in the presence or absence of protease inhibitors (E64d, pepstatin A). Protein samples were collected after 24 h treatment with AZM (10 μg/ml) and TGFB1 (2 ng/ml). In the lower panel is the average ( ± SEM) taken from 3 independent experiments shown as relative expression. *p < 0.05. (B) WB using anti-SQSTM1 and anti-ACTB of cell lysates from control (lane 1), TGFB1- (2 ng/ml) treated (lane 2, 4), and AZM (10 μg/ml) treated (lane 3, 4) LF. Protein samples were collected after 24 h treatment. In the lower panel is the average ( ± SEM) taken from 3 independent experiments shown as relative expression. *p < 0.05. (C) WB using anti-HSPA5, anti-p-ERN1, anti-ATF4, anti-ATF6, and anti-ACTB of cell lysates from control (lane 1), TGFB1- (2 ng/ml) treated (lane 2, 4), and AZM (10 μg/ml) treated (lane 3, 4) LF. Protein samples were collected after 24 h treatment. In the right panels are the average ( ± SEM) taken from 3 independent experiments shown as relative expression. *p < 0.05. (D) Changes of 20S proteasome activity by TGFB1 and AZM treatment. Cell lysates for measuring 20S proteasome activity were collected after 24 h treatment with control, TGFB1 (2 ng/ml), and concomitant TGFB1 and AZM (10 μg/ml). Shown in the right panel is the average ( ± SEM) taken from 3 independent experiments. *p < 0.05.