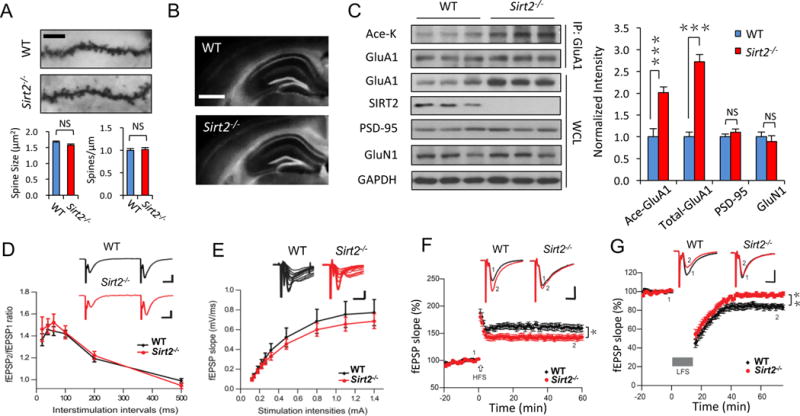
Figure 5. SIRT2 knock-out mice show enhanced AMPAR acetylation and impaired synaptic plasticity.

(A, B) Golgi staining showed no change in spine morphology and density in hippocampal neurons (n = 8 cells/group, scale bar, 5 μm) (A), and Hoechst staining showed normal gross morphology of the hippocampus (B) in Sirt2−/− mice, scale bar, 500 μm. (C) GluA1 acetylation and protein expression were significantly elevated in SIRT2 knock-out mice (Sirt2−/−), compared to C57BL/6 wild-type (WT) control mice (n = 8 mice/group). No significant differences were observed in other synaptic proteins like PSD-95 or GluN1 (n = 8 mice/group). (D, E) There is no significant difference between WT and Sirt2−/− mice in synaptic paired pulse facilitation (D) and input/output curve (E) (n = 12 slice/group). (F, G) Recordings of field potentials in hippocampal CA1 regions of acute brain slices showed impairments in LTP (F) and LTD (G) in Sirt2−/− mice (n = 12 slice/group). Scale bars: 10 ms, 0.5 mV. Bar graphs represent mean ± S.E., *P < 0.05, **P < 0.01, ***P < 0.001, NS, not significant. Student’s two-tailed t test (A–C) and one-way ANOVA (D–G).
