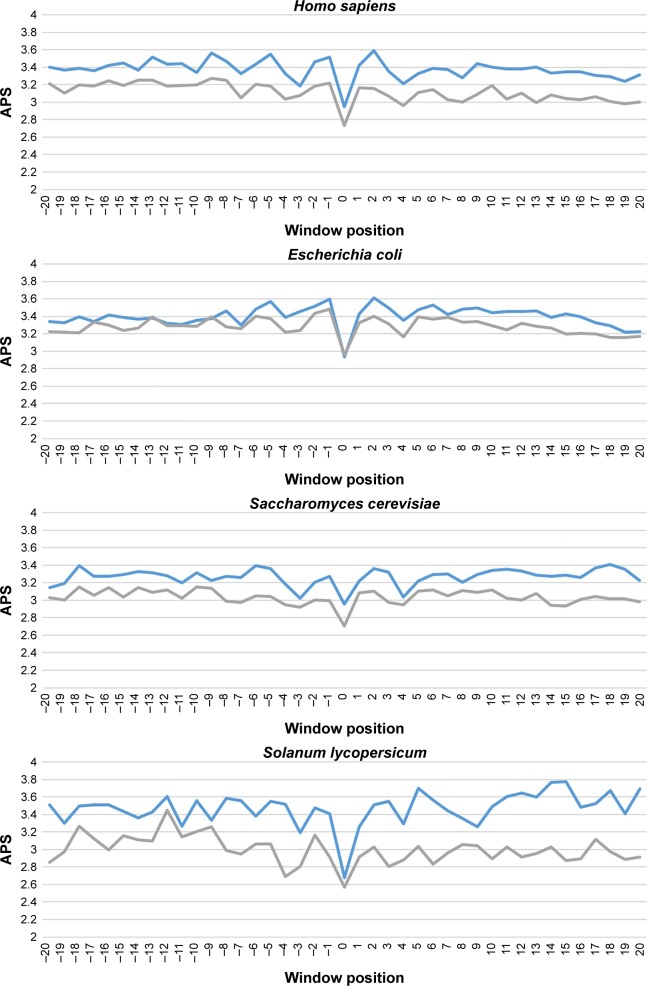
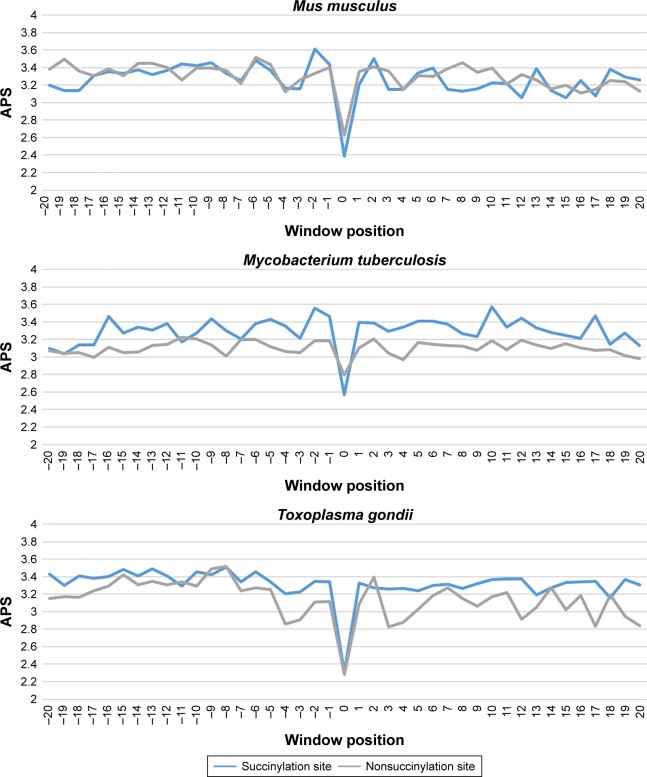
Figure 3.
Average PSSM score (APS) for each position of surrounding succinylation (green color) and nonsuccinylation (gray color) fragments for seven species, especially those fragments located in the positions of approximately −20 to −1 and +1 to +20 window position.
Note: P-values were calculated using Kruskal–Wallis test (Table S1).
Abbreviation: APS, average PSSM score.


