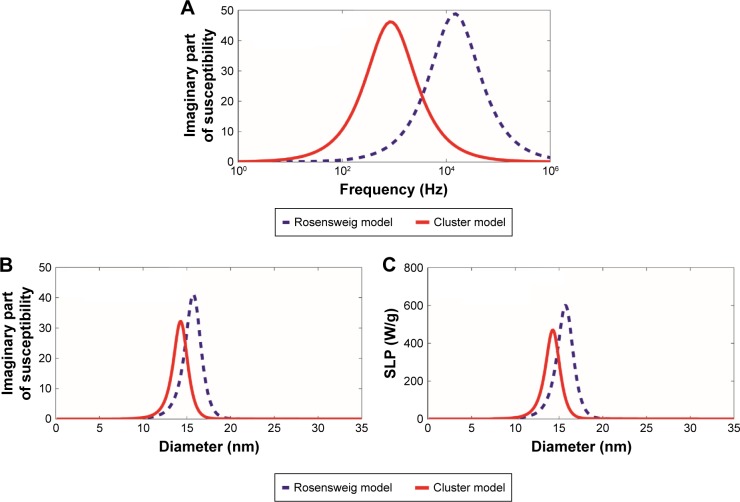
Figure 2.
Comparison with the Rosensweig model.
Notes: The imaginary part of the magnetic susceptibility, χ″, and the SLP were computed by our revised cluster-based model (red solid line) and the Rosensweig model (blue dashed line). (A) χ″ as a function of the alternating magnetic field frequency, f, for magnetic nanoparticle diameter =18 nm, alternating magnetic field amplitude H0=11 kA/m, and magnetic anisotropy constant Ka =15 kJ/m3. (B) χ″ as a function of the magnetic nanoparticle diameter for alternating magnetic field frequency f=410 kHz, alternating magnetic field amplitude H0=11 kA/m, and magnetic anisotropy constant Ka =15 kJ/m3. (C) The SLP, as a function of the magnetic nanoparticle diameter, using the same parameters as those in (B).
Abbreviation: SLP, specific loss power.

