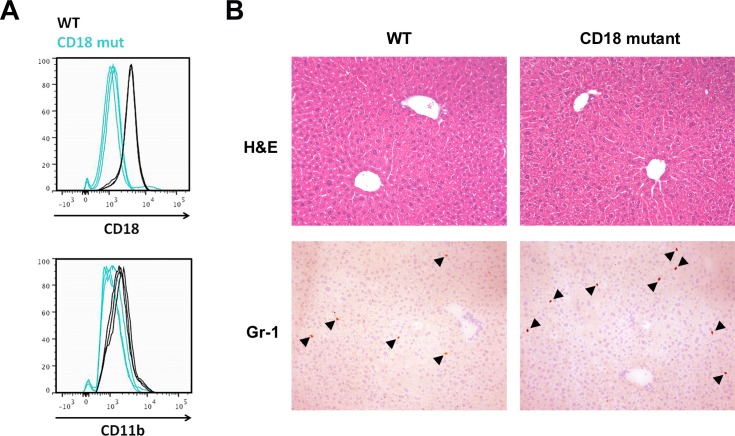
Fig 1. Comparative features of WT and CD18-mutant mice fed chow diets.
(A) CD18 and CD11b expression measured by flow cytometry in leukocytes isolated from the livers of chow-fed WT and CD18-mutant (CD18 mut) mice. The fluorescence intensity of CD18 mut granulocytes was 70% lower than that measured in WT granulocytes, n = 3 per group. (B) Liver histology and Gr-1 immunohistochemistry in WT and CD18 mut mice. Arrowheads mark Gr-1-positive cells. For cell counts, see text. Original magnification 10X.

