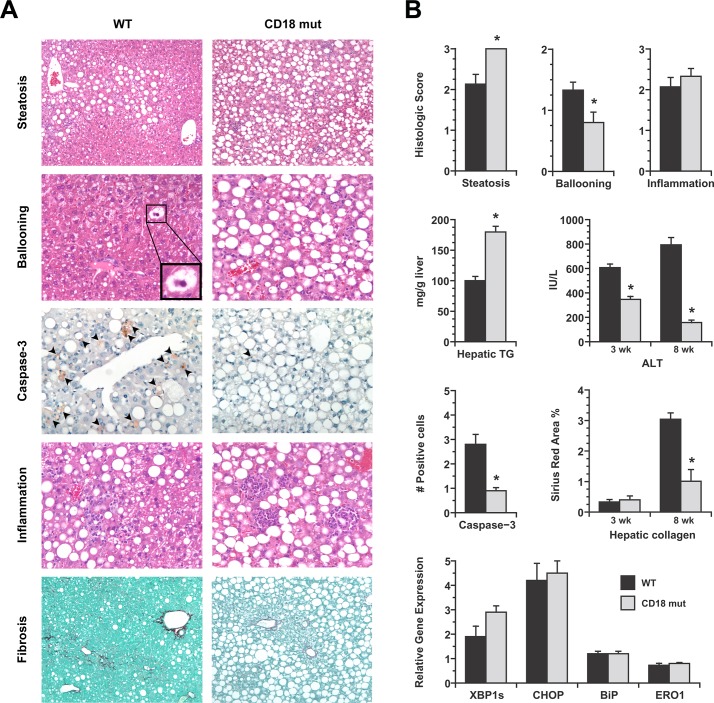
Fig 2. Comparative features of WT and CD18-mutant mice after MCD feeding.
(A) Photomicrographs illustrate several features of liver disease in WT and CD18-mutant (CD18 mut) mice after MCD feeding for 3–8 wk. Steatosis (H&E, 3 wk, 10X) is more severe in CD18 mut livers whereas ballooning (H&E, 3 wk, 10X) is more evident in WT livers. WT livers also have more cells staining positively for cleaved caspase-3 (20X). Hepatic inflammation is visible in both WT and CD18 mut livers, although cells are diffusely distributed in WT livers and clustered in CD18 mut livers. Hepatic fibrosis (Sirius red, 8 wk, 10X) is more advanced in WT livers than CD18 mut livers. (B) Graphs illustrate comparative histologic scores for steatosis, ballooning and inflammation in WT and CD18 mut mice at 3 wk, hepatic triglyceride concentration at 3 wk, and serum ALT measurements at 3 wk and 8 wk. Additional histograms illustrate quantitation of caspase-3-positive cells (# cells per 20X field) and quantitation of hepatic fibrosis (Sirius red, percent area). Final histograms show hepatic mRNA levels for several ER stress markers in WT and CD18 mut liver, normalized to chow-fed WT liver. XBP1s, X-box protein-1 spliced form; CHOP, CEBP-homologous protein; BiP, binding immunoglobulin protein; ERO1, ER oxidoreductin. Values represent mean ± SE for n = 10–15. * P < 0.05 vs. WT.

