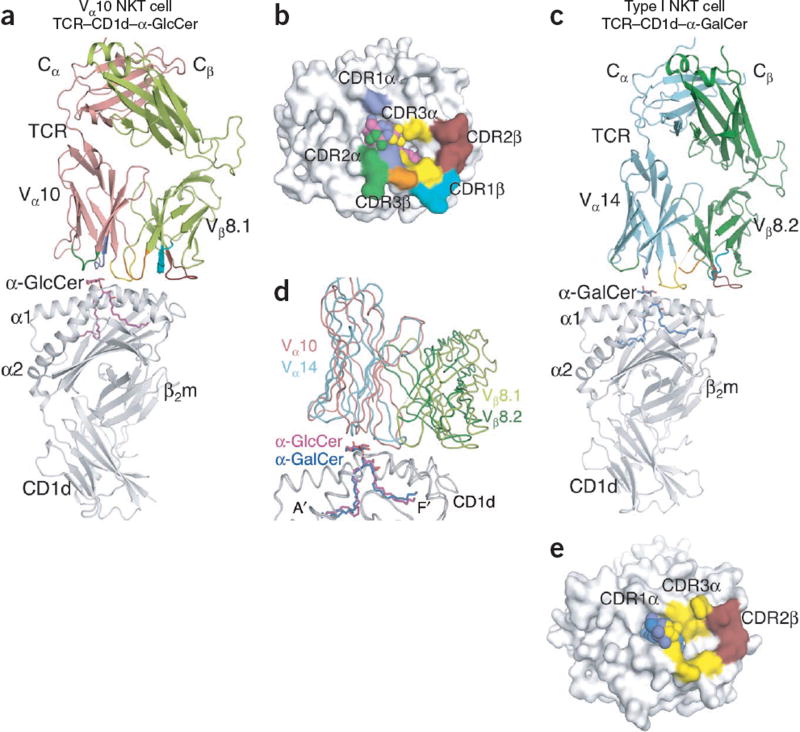
Figure 5.
Structural comparison of Vα10 NKT cell TCR–CD1d–α-GlcCer and type I NKT cell TCR–CD1d–α-GalCer. (a) NKT cell Vα10–Vβ8.1 TCR in complex with CD1d–α-GlcCer: magenta, α-GlcCer; gray, CD1d; salmon, Vα10; light green, Vβ8.1; purple, CDR1α; dark green, CDR2α; yellow, CDR3α; teal, CDR1β; ruby, CDR2β; orange, CDR3β. β2m, β2-microglobulin. (b) Footprint of the NKT cell Vα10–Vβ8.1 TCR on the surface of CD1d–α-GlcCer: spheres indicate α-GlcCer; colors of CD1d and CDR loops as in a. (c) Type I NKT cell Vα14–Vβ8.2 TCR in complex with CD1d–α-GalCer14: blue, α-GalCer; cyan, Vα14; dark green, Vβ8.2; colors of CD1d and CDR loops as in a. (d) Superposition of NKT cell Vα10–Vβ8.1 TCR–CD1d–α-GlcCer and type I NKT cell Vα14–Vβ8.2 TCR–CD1d–α-GalCer (colors as in a,c). (e) Footprint of the type I NKT cell Vα14–Vβ8.2 TCR on the surface of CD1d–α-GalCer: spheres indicate α-GalCer; colors of CD1d, α-GalCer and CDR loops as in a,c.

