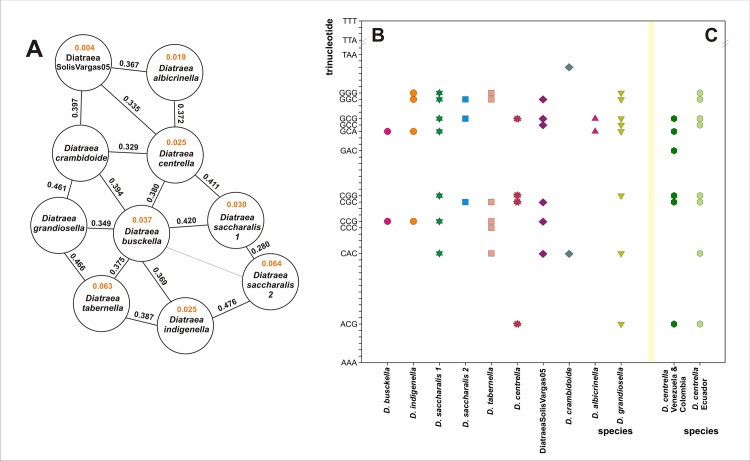
Fig 4. Relative abundance of trinucleotides for CO II.
A. Distances between pairs of trinucleotide-based genetic signatures. Black numbers indicate interspecies distances and orange numbers indicate the average of intraspecific distances. Diatraea saccharalis 1 and 2 are analyzed as different phylogenetic groups (putative cryptic species). B. Differential patterns of trinucleotide absences in the sense strand of CO II fragment sequences from each analyzed clade. In the Y-axes are indicated only the two trinucleotide limits considered of the 64 possibilities (AAA and TTT) and all those which are absent in some sequences. C. Differential patterns of trinucleotide absences between the isolates of D. centrella from Venezuela (Vz) and Ecuador (Ec) [22]. DSV05 = DiatraeaSolisVargas05.

