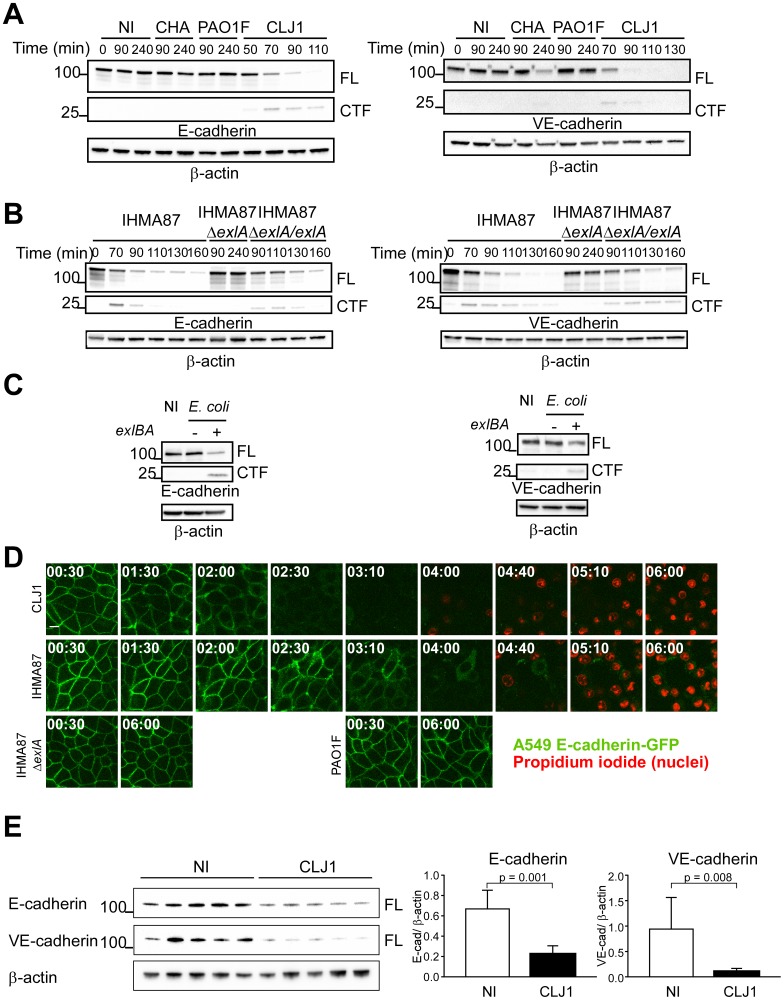
Fig 1. ExlA-dependent cleavage of E- and VE-cadherins.
A. A549 cells (left) or HUVECs (right) were incubated with various P. aeruginosa strains: CHA, PAO1F or CLJ1, or were mock-infected with LB (NI). Cell extracts were prepared at different times post-infection, as indicated and analysed by Western blot using E-cadherin (left) or VE-cadherin (right) antibodies. In both cases, the full-length (FL) and post-cleavage C-terminal (CTF) fragments are shown. β-actin was used as loading control. The experiment was performed 3 times for A549 and twice for HUVECs with similar results. B. A549 cells (left) and HUVECs (right) were incubated with IHMA87, IHMA87ΔexlA or IHMA87ΔexlA/exlA strains, and cellular extracts were analysed as above. The experiment was performed 3 times for A549 and once for HUVECs. C. Similar experiments with A549 cells (left) or HUVECs (right) incubated with E. coli containing the empty vector (exlBA -) or E-coli expressing ExlB-ExlA (exlBA +). D. A549-E-cadherin-GFP cells were incubated with CLJ1, IHMA87, IHMA87ΔexlA or PAO1F bacteria. E-cadherin-GFP (green) as well as nuclei labelling by propidium iodide (red) were followed by confocal videomicroscopy. Times post-infection are shown as “h:min”. One z-position is represented. The experiment was performed twice, with 4–5 positions recorded each time. All films showed similar results. E. Mice (5 per condition) were infected by bacteria inhalation (2.5x10⁶), using CLJ1 strain, or were mock-infected with PBS (NI). Mice were euthanized at 18 h.p.i.; protein extracts were prepared from lungs and were analysed by Western blot using E- and VE-cadherin antibodies (left). Histograms (right) show the E-cadherin/ β-actin and VE-cadherin/ β-actin ratios of band intensities, represented as means + s.d. Significance was calculated using Mann-Whitney’s test, as variances were not equal. The experiment was repeated once, with similar results.

