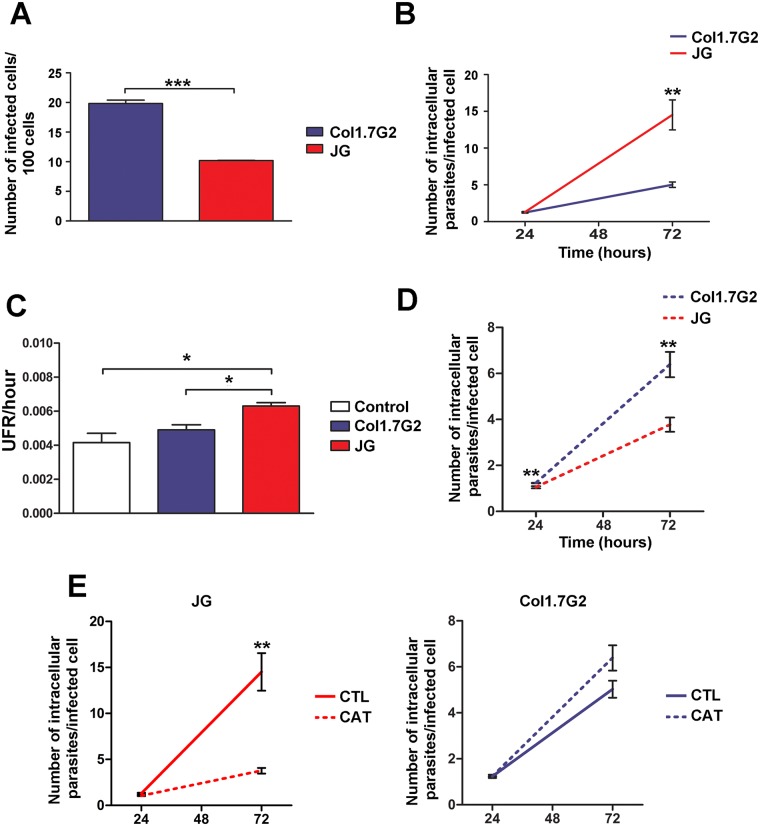
Fig 6. (A-B) Quantification of invasion and intracellular multiplication rates of Col1.7G2 and JG in human cardiomyocyte cultures.
Cultures of human cardiomyocytes derived from iPSCs were exposed to Col1.7G2 or JG and the number of infected cells per 100 cells (A), as well as the number of intracellular parasites per infected cell (B), were evaluated for the determination of invasion and intracellular multiplication rates, respectively. The data represent the mean of triplicates ± the standard error of the mean (SEM). (C) Relative fluorescence of oxidized CM-H2DCFDA present in human cardiomyocyte cultures, 48 hours after infection with Col1.7G2 or JG. Cultures of uninfected human cardiomyocytes maintained for the same time were used as controls. The data represent the mean of duplicates ± the standard error of the mean (SEM). (D) Quantification of intracellular multiplication rates of Col1.7G2 and JG in cultures of human cardiomyocytes treated with catalase. Human cardiomyocyte cultures from iPSCs were treated with catalase and then exposed to Col1.7G2 or JG and the number of intracellular parasites per infected cell was evaluated. The data represent the mean of triplicates ± the standard error of the mean (SEM). (E) Combination of data from graphs shown in B and D, showing JG or Col1.7G2 intracellular growth from independent experiments performed in catalase treated (dashed lines) and non-treated (continuous lines) human cardiomyocyte cultures. Asterisks indicate statistically significant differences (*** p≤0.001, ** p≤0.01 and * p≤0.05—Student's t-test).

