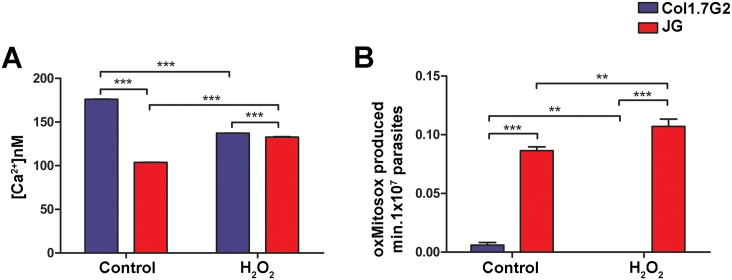
Fig 8. Quantification of epimastigotes intracellular levels of calcium (A) and superoxide anion (B) upon JG and Col1.7G2 epimastigotes treatment with H2O2.
(A) JG and Col1.7G2 cells previously incubated with fura 2-AM, were treated or not (control) with 30 μM H2O2 for 30 minutes and the calcium levels in 107 parasites/mL was determined. (B) JG and Col1.7G2 parasites were incubated with MitoSOX and subsequently exposed to 30 μM H2O2 for 30 minutes, the oxMitoSOX level was measured in 107 parasites/mL. The data represent the mean of triplicates ± the standard error of the mean (SEM). Asterisks indicate statistically significant differences (**<0.01 *** p≤0.001—Student's t-test).

