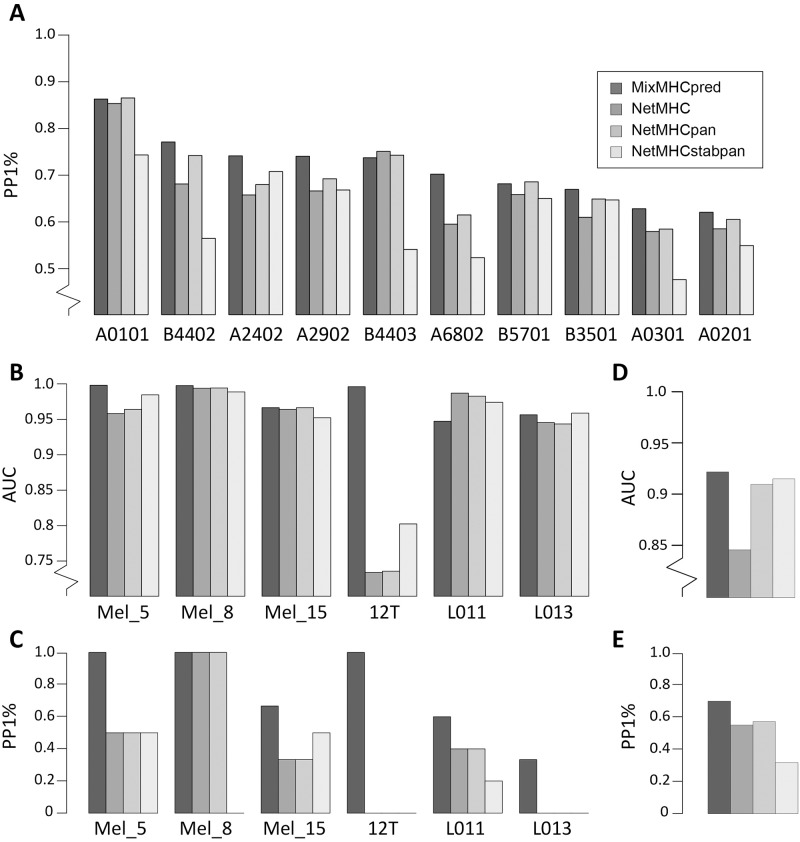
Fig 4. Comparison between our predictor (MixMHCpred1.0) and existing tools.
A: Fraction of the true positives among the top 1% predictions (PP1%) for the naturally presented HLA-I ligand identified in mono-allelic cell lines, with 99-fold excess of decoy peptides. Of note, PP1% is equivalent to the both Precision and Recall, since the number of actual positives is the same as the number of predicted positives. B-C: Graphical representation of results in Table 1 and Table C in S1 Supporting Information. Panel B shows the AUC values and panel C the fraction of neo-antigens predicted in the top 1% of predictions (which typically corresponds to what is experimentally tested for immunogenicity). D-E: Predictions of Cancer Testis Antigens from the CTDatabase. Panel D shows AUC values and panel E shows PP1%. Truncated y-axes are explicitly indicated.

