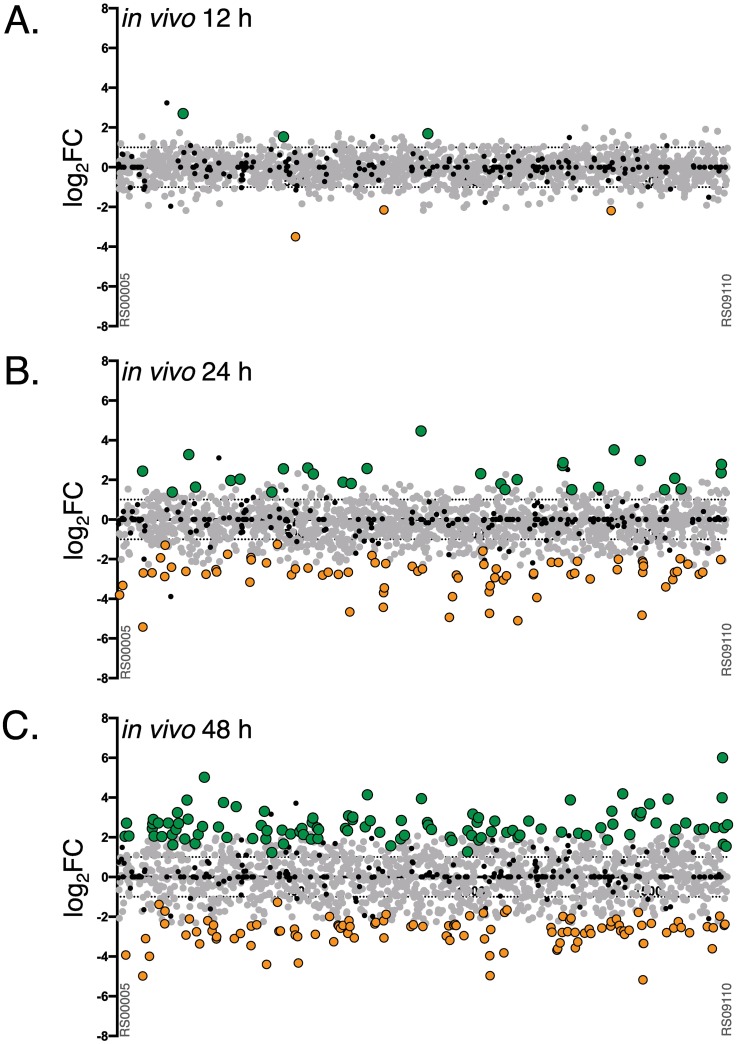
Fig 4. Tn-seq analyses of M1T1 GAS 5448 fitness during murine skin and soft tissue infection.
Genome-scale summary of the ratios of mutant abundance (log2FC, Y axis) calculated using DEseq2 for each gene (X axis) comparing the GAS 5448 Krmit library composition retrieved from in vivo lesions after 12, 24 and 48 HPI versus the T0 input pools (A, B and C, respectively). Gene mutations conferring decreased (log2FC < -1, p < 0.05) or increased fitness (log2FC > 1, p < 0.05) are indicated with orange and green circles, respectively. Neutral mutations (grey circles) and essential genes (black circles) are also indicated.

