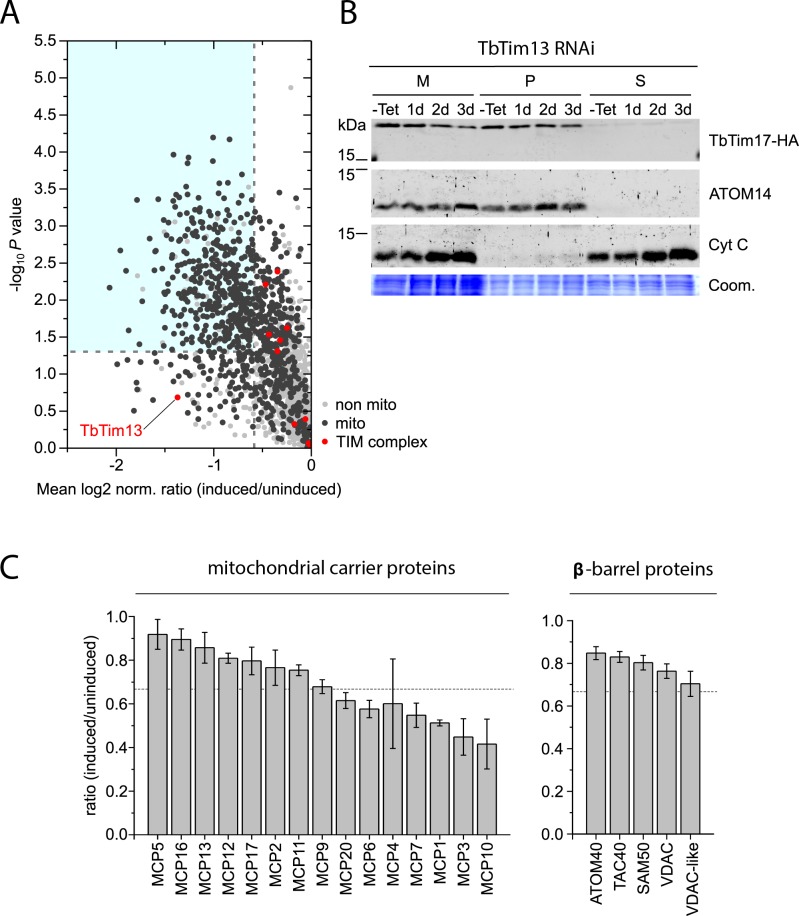
Fig 6. Global analysis of mitochondrial protein abundance changes upon ablation of TbTim13.
A) Crude mitochondrial fractions of uninduced and induced (2.5 days) TbTim13 RNAi cells were subjected to quantitative MS using peptide stable isotope dimethyl labeling. For proteins exhibiting decreased abundance upon expression of TbTim13 RNAi, the mean log2 of normalized ratios (induced/uninduced) was plotted against the corresponding–log10 P value (two-sided t-test). The t-test significance level of 0.05 is indicated by a horizontal dashed line, while the vertical dashed line indicates a fold-reduction in protein abundance of 1.5. Mitochondrial proteins (dark grey) and TIM complex components (red) are highlighted. For a complete list of proteins see S3 Table. B) Alkaline carbonate extraction of crude mitochondrial extracts from a cell line expressing TbTim17-HA in the background of TbTim13 RNAi was performed after 0–3 days of induction. Equal cell equivalents of crude mitochondria (M), membrane pellets (P) and soluble fractions (S) were subjected to SDS-PAGE and western blotting. The single-spanning outer membrane protein ATOM14 and the IMS protein Cyt C serve as markers for the membrane and soluble fraction, respectively. The Coomassie-stained gel serves as a loading control (Coom.). C) Individual abundance ratios (induced/uninduced) of all MCPs and β-barrel proteins detected in the experiment shown in (A). Dashed horizontal line, 1.5 fold reduction. Standard deviations are indicated.

