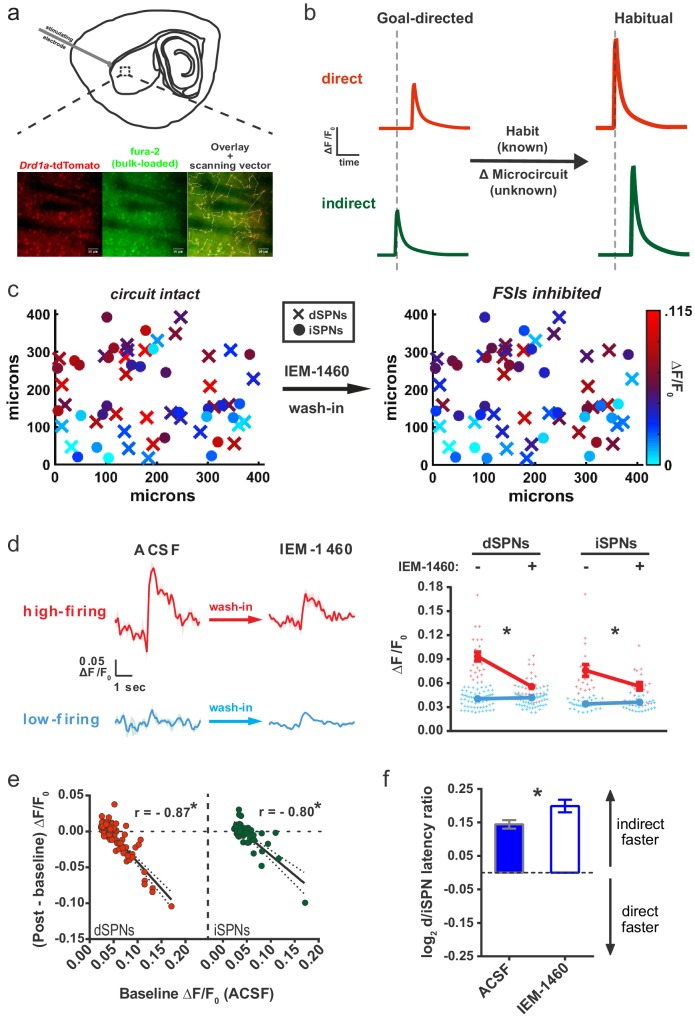
Figure 1. Striatal output reconfiguration following pharmacological inhibition of FSIs directly opposes substrates for habitual behavior.
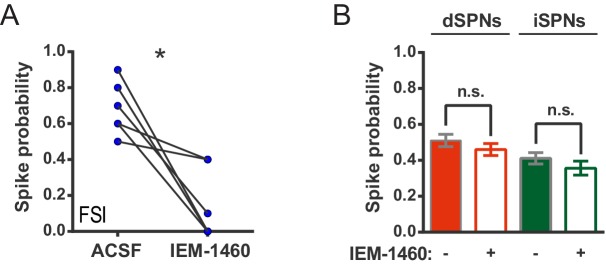
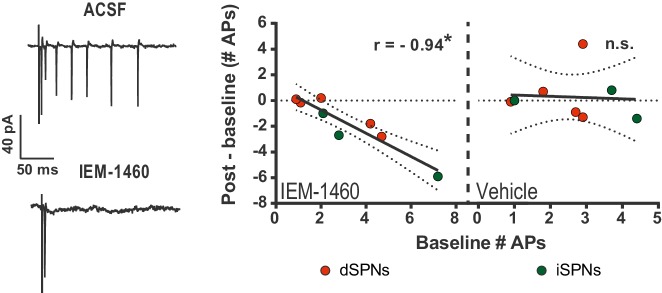
(A) Schematic of calcium imaging approach. Top: SPN activity was evoked by electrical stimulation of cortical afferent fibers in an acute parasaggital brain slice. Bottom: Evoked SPN firing was imaged in the direct and indirect pathways simultaneously using a transgenic direct pathway reporter mouse line (left), calcium indicator dye fura-2 (middle) and two-photon laser scanning microscopy (right, see scanning vector in overlay). (B) Experimental approach. Striatal microcircuitry was manipulated in tissue from untrained animals in order to reproduce the known circuit substrate for habitual behavior (described in O'Hare et al., 2016) and thereby identify a candidate microcircuit mechanism. (C) Representative heat maps of dSPN (x) and iSPN (●) calcium transient amplitudes before (left) and after (right) pharmacological inhibition of FSIs using IEM-1460 show a selective reduction in cells with the strongest (bright red) initial responses. (D) Left: Representative SPN calcium transient waveforms before and after wash-in of IEM-1460. SPNs were grouped into ‘high-firing’ (red) or ‘low-firing’ (blue) clusters based solely on their baseline response amplitudes using a Gaussian mixture model. SPNs with strong baseline responses (red, ‘high firing’) show weaker responses after wash-in whereas those with initially weak responses (blue, ‘low firing’) are unaffected. Right: Evoked calcium transient amplitudes for all imaged SPNs before (-) and after (+) wash-in of IEM-1460. For both cell types, high-firing SPNs showed decreased responses after IEM-1460 wash-in (dSPNs: t(22) = 6.43, p=0.0000018, n = 23 cells; iSPNs: t(17) = 3.43, p=0.0032, n = 18 cells) whereas low-firing SPNs did not (dSPNs: p=0.24, n = 64 cells; iSPNs: p=0.21, n = 34 cells). (E) Linear regression and correlational analyses show that the inhibitory effect of IEM-1460 on SPN responses (post – baseline difference) is a linear function of baseline response amplitudes for both dSPNs (red; r(86) = −0.87, p=2.20×10⁻²⁸, n = 87 cells) and iSPNs (green; r(51) = −0.80, p=1.59×10⁻¹², n = 52 cells). (F) Relative pathway timing, as measured by latency to peak detection, before and after inhibition of FSIs using IEM-1460. Indirect pathway activation precedes direct pathway activation by a greater margin after wash-in of IEM-1460 (t(102) = 2.42, p=0.017, n = 52 independent dSPN/iSPN pairs). *p<0.05. Dotted error bands indicate 95% confidence interval. Error bars indicate SEM. Effects of IEM-1460 on FSI and SPN spike probability are shown in Figure 1—figure supplement 1. Electrophysiological assessment of IEM-1460’s effect on evoked multi-AP SPN responses is included in Figure 1—figure supplement 2. GMM parameters and calcium transient amplitude source data can be found in Figure 1—source data 1.


