
Figure 2. C. elegans avoids the SDS analogs dodecanoate and decanoate.
(A) Quantification of the similar phasmid responses to 3.4 mM and 0.6 mM SDS, which is ten-fold below the critical micelle concentration of SDS. All other assays in this study were performed with 0.6 mM SDS to preclude the possibility of surfactant activity. The surfactant Triton X-100 at its critical micelle concentration is not strongly sensed by the phasmid neurons. (B) Quantification of the reduced responses to molecules with shorter tail length or a less polar head group than SDS. SDS and sodium hexyl sulfate were tested at 0.6 mM and 1-dodecanol was tested at 1 mM. (C) Quantification of the similar phasmid responses to SDS, dodecanoate, decanoate and nonanoate. All compounds except SDS were tested at 1 mM. Note that compounds are represented as the predominant form in a pH 7 solution, the carboxylates. (D) Quantification of the similar amphid responses to SDS, dodecanoate, decanoate and undecanoate, and slower responses to nonanoate and 1-decanol. All compounds except SDS were tested at 1 mM. Note that carboxylate forms are again represented. (A–C) For phasmid assays, one-way ANOVA and Tukey’s post-hoc test were performed. (D) For amphid assays, two-sample z-tests and the Hochberg multiple comparison adjustment procedure were performed. (A–D) For all experimental samples, n ≥ 40 for the experimental group, n ≥ 40 for the 0.6% SDS positive control, and n ≥ 40 for the saline buffer negative control. ***B, p<0.001; *B, p<0.05; ns B, not significant compared with a control buffer; ***S, p<0.001; ns S, not significant compared with SDS positive control. Exact values and additional pairwise comparisons are included in Figure 2—source data 1 and Figure 2—source data 2.

Figure 2—figure supplement 1. CAS numbers for compounds purchased for this study.
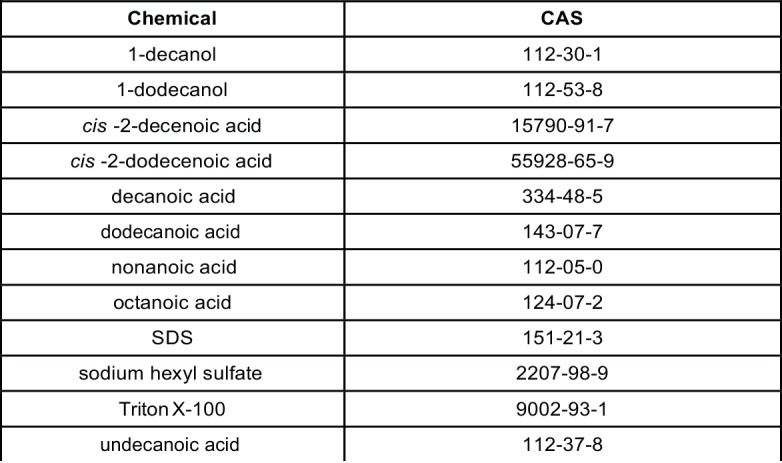
Figure 2—figure supplement 2. Response to different concentrations of SDS, dodecanoate and decanoate.
