. 2017 Sep 5;6:e24196. doi: 10.7554/eLife.24196

Figure 3. Average genotype-specific amino acid identity of DENV isolated in CYD-TDV trials compared to the vaccine strain of the corresponding DENV serotype.

Black bars indicate the IQR of the full sample set. Coloured dots show the geographic regions from which each genotype was collected – red: CYD14, maritime SE Asia; blue: CYD14, mainland SE Asia; grey: CYD15, Americas. Black dots indicate the genotype of the serotype-specific CYD-TDV vaccine component.

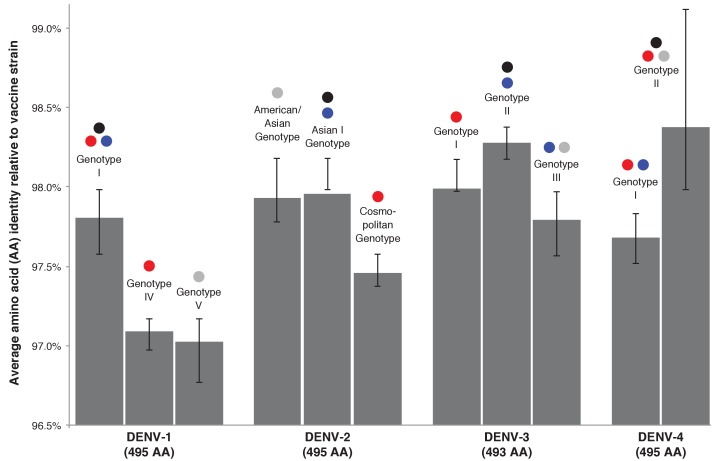
Figure 3.

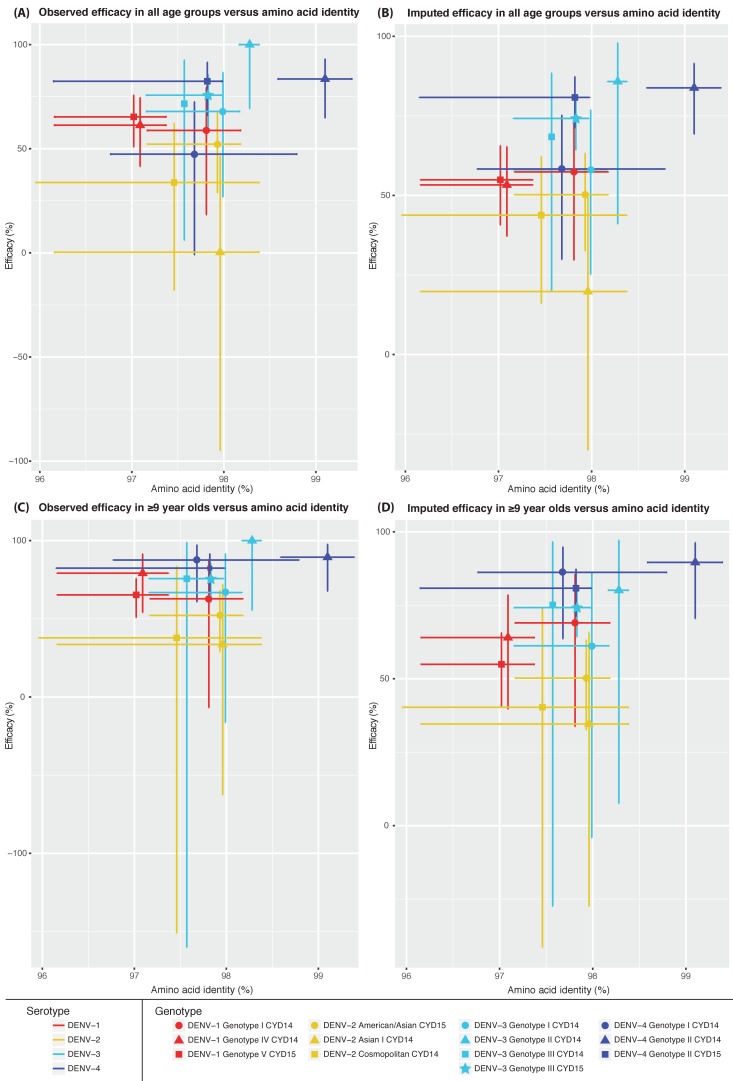
Figure 3—figure supplement 1. Genotype-specific amino acid identity of DENV isolated in CYD-TDV trials compared to the vaccine strain of the corresponding DENV serotype versus vaccine efficacy.

Figure 3—figure supplement 1.

Symbols indicate the intersection of mean amino acid identity to CYD-TDV components and mean genotype-specific vaccine efficacy. Bars on the x-axis indicate the range of pairwise amino acid identities of DENV isolated in the trials compared to the CYD-TDV component. Bars on the y-axis indicate the 95% confidence intervals calculated for vaccine efficacy estimates. DENV-1 genotypes are shown in red, DENV-2 in yellow, DENV-3 in aqua, DENV-4 in blue. (A) Mean amino acid identity versus observed vaccine efficacy across all age groups. (B) Mean amino acid identity versus imputed vaccine efficacy across all age groups. (C) Mean amino acid identity versus observed vaccine efficacy in subjects ≥ 9 years of age. (D) Mean amino acid identity versus imputed vaccine efficacy in subjects ≥ 9 years of age.