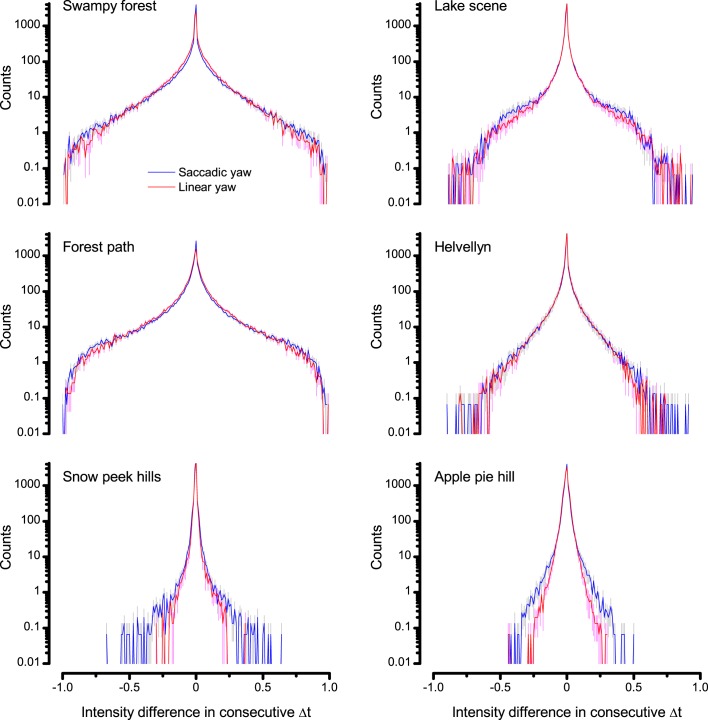
Appendix 3—figure 3. Difference histograms of the six panoramic images of natural scenes (used in this study) as scanned by saccadic (blue) and linear (red) yaw signals of the same median velocity.
Saccadic viewing increased the burstiness (Video 1) and, thus, sparseness in the difference histograms beyond that of the linear viewing. This was because saccades, proportionally, generated more large light intensity variations; seen by the extended flanks of the histograms. Conversely, fixation periods prolonged the periods of similar light intensities. Thus, the likelihood that the light intensity at one moment would be similar or the same at the next moment was increased; seen by the histograms’ higher counts for zero difference.

