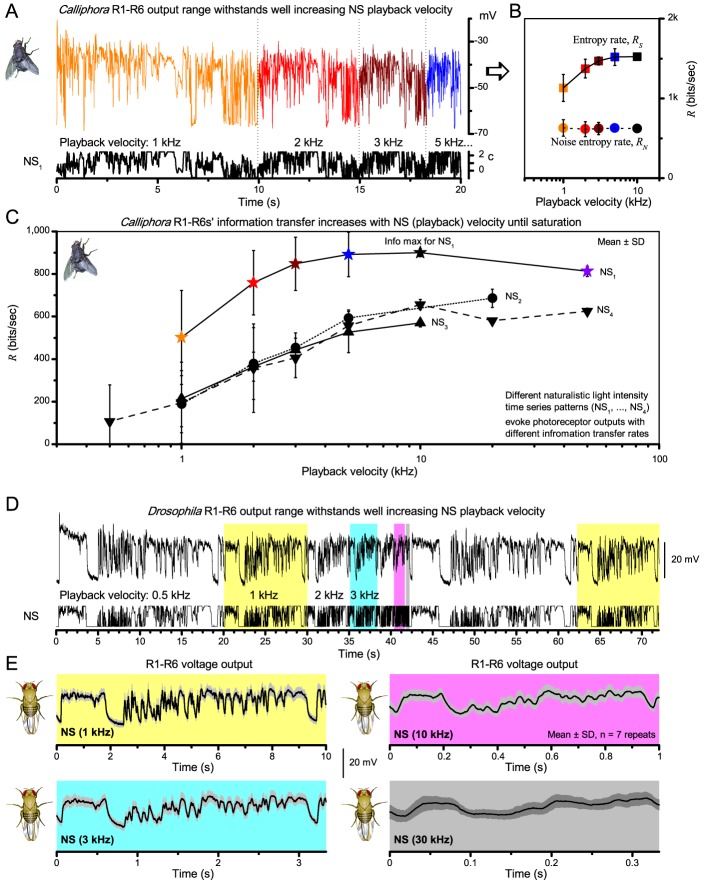
Appendix 3—figure 4. Photoreceptor output information rate depends on the speed and temporal structure of naturalistic stimulation (NS).
(A) Intracellular voltage responses of a blowfly (Calliphora vicina) R1-R6 to a NS sequence repeated at different playback velocities. (B) The entropy rate, RS, of photoreceptor responses increases with the playback velocity until saturation, whereas the noise entropy rate, RN, remains virtually unchanged (cf. photoreceptor noise power spectra in Figure 2—figure supplement 2A). This improves the photoreceptor's encoding performance. (C) Information transfer rate (Shannon, 1948; Juusola & de Polavieja, 2003) (R = RS RN) increases with playback velocity for four different NS sequence until saturation. Such dynamics resemble information maximization in Drosophila photoreceptor output by stimulus bandwidth broadening (Figure 2C). However, because Calliphora R1-R6s generate quicker responses than Drosophila R1-R6s, their information transfer saturates at considerably higher stimulus frequencies (Juusola et al., 1994; Juusola and Hardie, 2001b; Juusola and Hardie, 2001a; Gonzalez-Bellido et al., 2011; Song et al., 2012; Song and Juusola, 2014), suggesting superior encoding performance at high saccadic velocities. (A–C) Data is from (Juusola and de Polavieja, 2003) (Figure 5). (D) Drosophila R1-R6 output shows relative scale-invariance to NS pattern speed. NS was repeated at different playback velocities and the corresponding intracellular responses of a R1-R6 are shown above. Responses to four NS velocities are highlighted (yellow: 1 kHz, 10 s window; cyan: 3 kHz, ∼3.3 s window; magenta: 10 kHz, 1 s window; gray: 30 kHz, ∼0.3 s window). (E) The time-normalized shapes of R1-R6 output emphasize similar aspects in NS, regardless of the used playback velocity (here from 0.5 to 30 kHz). R1-R6s integrate voltage responses of a similar size for the same NS pattern, much irrespective of its speed. Mean ± SD shown, n = 7 traces. (D–E) Data is from (Zheng et al., 2009) (Figure 4).

