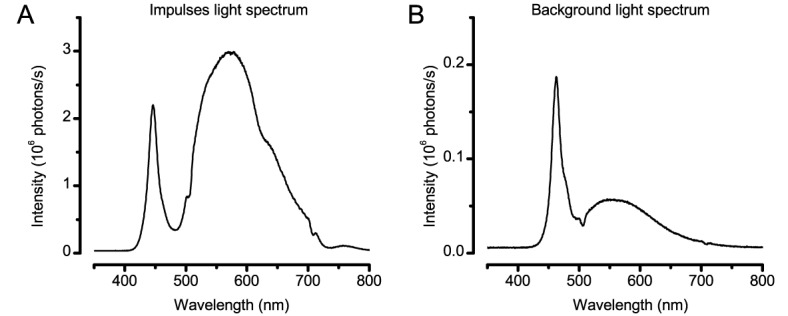
Appendix 4—figure 3. Spectral properties of the light stimuli.

(A) Typical spectral density of the light impulses delivered by the 25-point array. Note the spectra has two prominent peaks, named Peak1 (~450 nm) and Peak2 (~570 nm). (B) Spectral density of a single LED on the two Lamina pads, which were used to provide ambient background illumination during light-adaptation experiments. These spectral intensities (photon counts) were measured by a spectrometer (Hamamatsu Mini C10082CAH, Japan).
