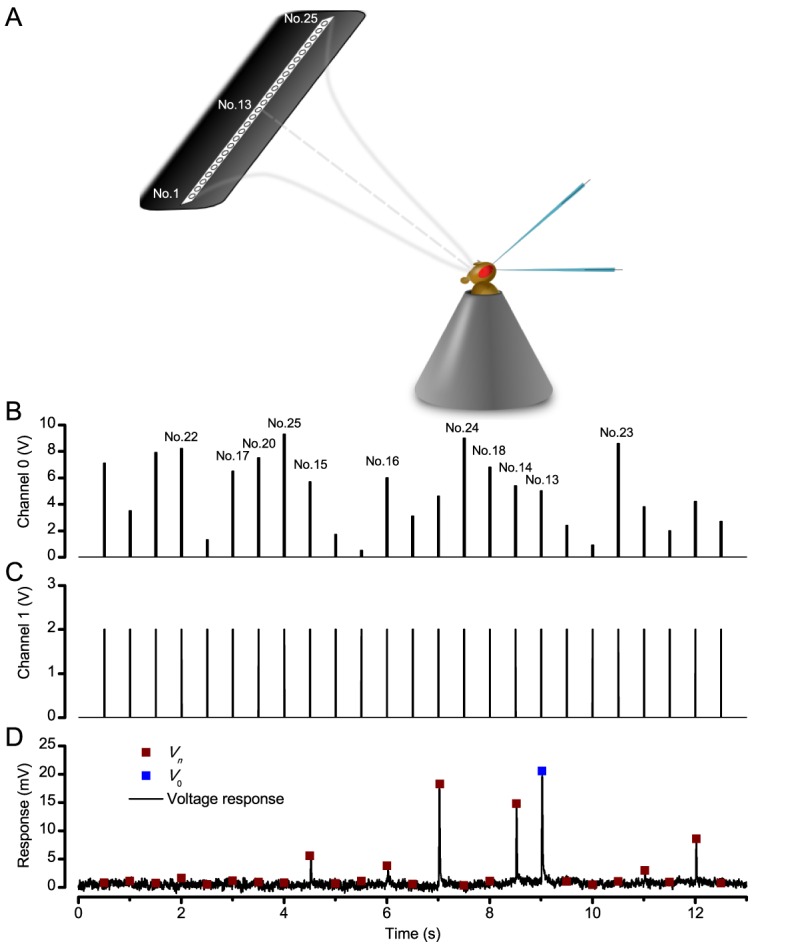
Appendix 4—figure 4. Measuring a R1-R6 photoreceptor’s receptive field with intracellular recordings.

(A) Schematic Image of how the LED stimulus array - seen as 25 light-points (light-guide-ends in a row) was centered by a Cardan arm system in respect to the studied photoreceptor and the fly eye. (B) Channel 0 input was used to select the LED (light-point) to be turned on. (C) Channel one input defined light intensity of the selected LED. A standard light impulse (flash) was produced by a 2 V input, which lasted 10 ms. (D) A photoreceptor’s intracellular voltage responses to a complete receptive field scan. These sub-saturating responses were recorded at 19°C. Amplitude Vn of each flash response was the local maxima. V0 is the amplitude of the response to a light flash at the center of the receptive field (on-axis).
