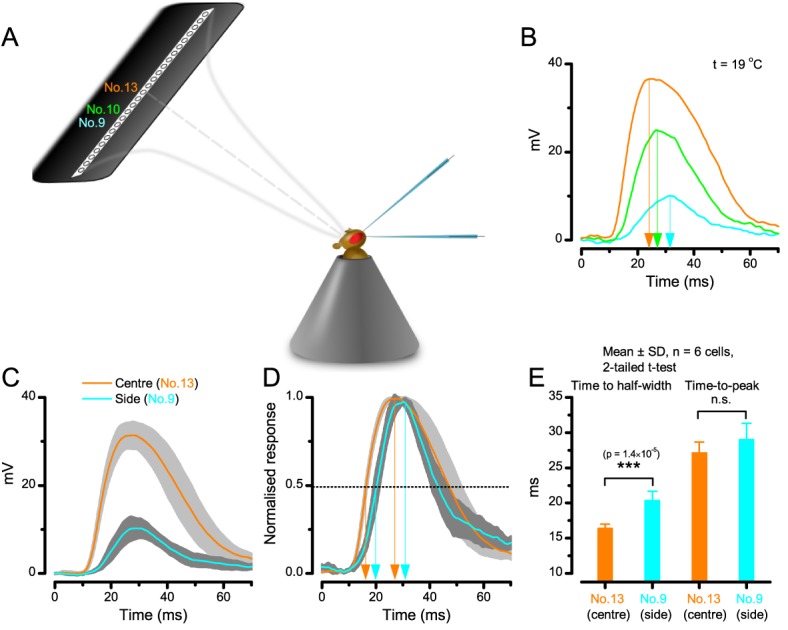
Appendix 6—figure 2. A R1-R6 photoreceptor’s sensitivity is the highest at the center of its receptive field.

(A) Schematic showing how subsaturating isoluminant light pulses were delivered at different locations within each tested photoreceptor’s receptive field. (B) The center stimulus (light-point No.13) typically evoked a response (orange trace) with the larger amplitude and faster rise-time than any stimulation at the flacks (light-points No.9 and No.10, respectively). (C) Average voltage responses of six photoreceptors to corresponding center and side stimulation. (D) Normalized responses make it clear that the responses to the center stimulus rise faster. (E) Time to the half-width response is significantly briefer (p = 1.39×10⁻⁵) with the center stimulus. However, time-to-peak of the responses to center and side light-points shows more variability between individual cells (p = 0.125). Mean ± SD; two-tailed t-test; nwild-type = 6 cells.
