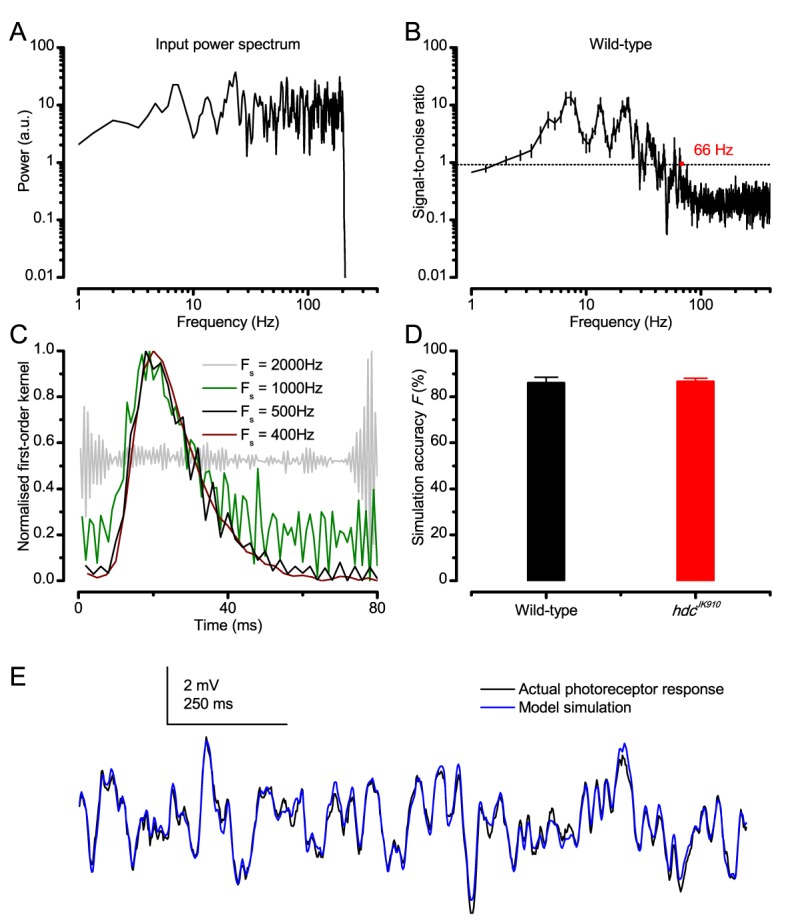
Appendix 6—figure 7. Predicting responses to Gaussian white noise (GWN).

(A) GWN light stimulus power spectrum with 200 Hz cut-off frequency. (B) Signal-to-noise ratio (SNR) of a wild-type R1-R6 photoreceptor’s voltage response at 19°C. Here, because the mean stimulus intensity was kept well within the subsaturating range (100-times lower than in the experiments of the main paper), having 200 Hz bandwidth, SNRmax of the photoreceptor output was ~ 20 (consistent with high-quality recordings for this specific stimulus condition) (Juusola and Hardie, 2001a). Noise power exceeded signal power at around 66 Hz. hdcJK910 R1-R6 outputs exhibited similar characteristics (data not shown for clarity). (C) Examples of kernels computed at different sampling rates from the same raw data. (D) Accuracy of GWN response simulation by Volterra series models for wild-type and hdcJK910 R1-R6s. Fwild-type = 86 ± 2.5%, Fhdc = 86.6 ± 1.6%. (E) Simulations of Drosophila R1-R6 responses to GWN stimuli matched the actual data closely. (B, D) Mean ± SEM, nwild-type = 9, nhdc = 8.
