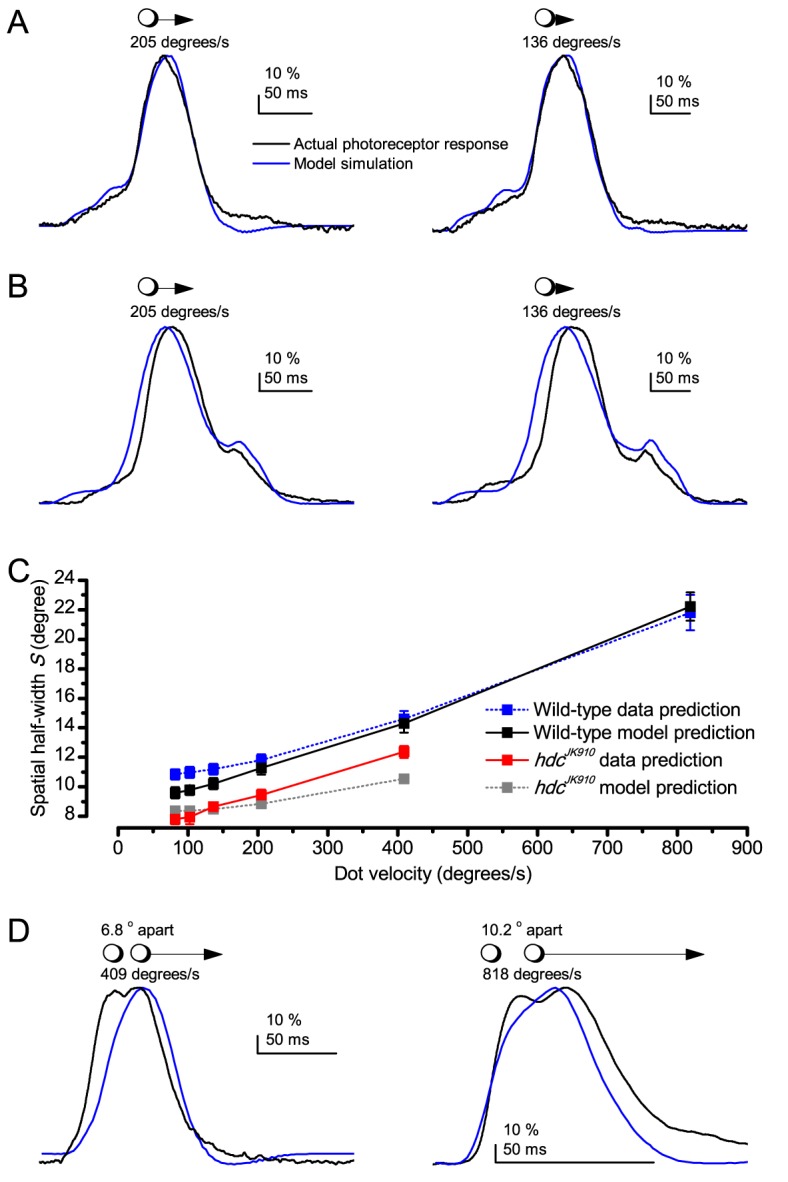
Appendix 6—figure 8. Prediction accuracy of the Volterra series photoreceptor models to moving point-objects varies considerably.

(A) Two examples of model simulations, which were reasonably close to the actual intracellular recordings to the tested dot motion. (B) Two examples of simulations that clearly differed from the recordings. (C) Theoretical predictions of photoreceptor output spatial half-width, calculated from the recordings and simulations as a function of the point-object speed. Mean ± SEM, nwild-type = 9, nhdc = 8. The theoretical spatial half-widths of the simulations differ from those of the recordings. E.g. the wild-type recordings (black) predicted consistently narrower S than the corresponding simulations (blue). The predicted resolvability of the resulting neural image, or spatial half-width (S), was consistently lower for the simulations than for the recordings. (D) Crucially, Volterra series models failed to predict how well the actual photoreceptor output resolves two close objects moving together very fast (shown for 409 and 818 o/s). For the 818 o/s prediction, we used here the fastest impulse response, recorded from another cell, but even so, the model still could not resolve the two dots. Thus, the actual spatial half-width of R1-R6s, limiting Drosophila’s resolving power at high image velocities, is about half of that estimated in (C). (Note, the dynamic biophysical mechanisms causing this difference – both in light input and photoreceptor output - are explained in Appendix 8. Recordings and simulations were at 19°C.
