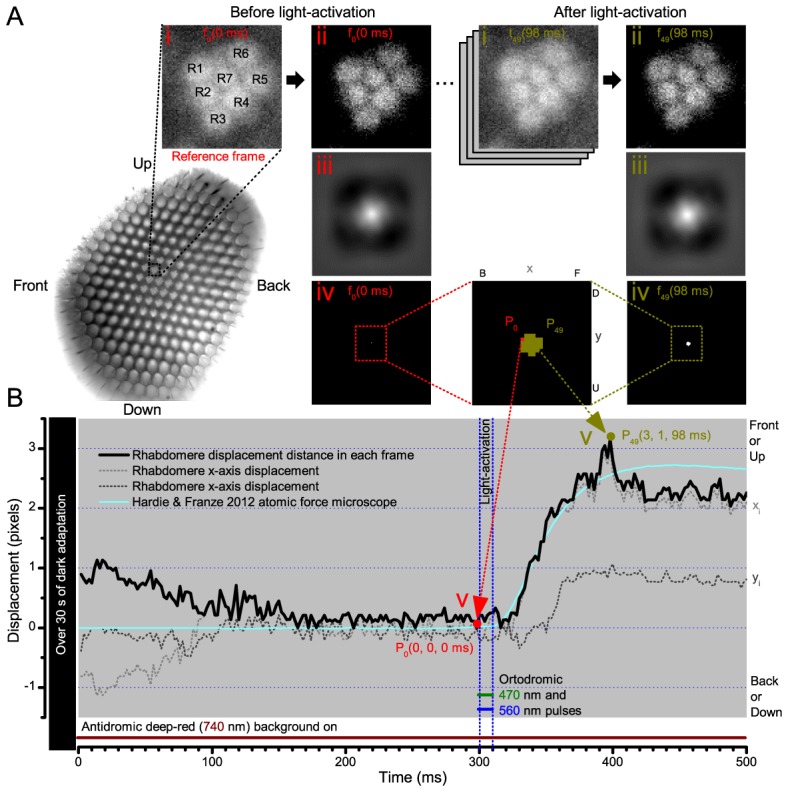
Appendix 7—figure 4. Cross-correlation image analysis to estimate photomechanical R1-R7 rhabdomere movements.

(A) Analytical steps are shown for the reference frame at time zero (f0), 2 ms before the 10 blue/green light stimulus pulse (red), and for the frame at the maximum rhabdomere displacement (f49), 98 ms after (dark yellow). High-speed camera images of rhabdomeres were recorded using 750 nm red light. (i) Image stacks were uploaded, and (ii) the median of each frame was subtracted to remove its noise background. (iii) 2D cross-correlation was calculated for each frame, and (iv) the values within 5% of their peak value were selected. (v). ) The weighted mean peak positions gave each frame’s x- and y-positions at its specific time point, and their distance, sqrt(x2+y2), the total rhabdomere displacement (in pixels) against the reference frame position. Notice that the 2D cross-correlation images have flipped x- and y-axis directions (up, U, appears down, D; front, F, appears back, (B). (B) The resulting rhabdomere displacement distance and the corresponding x- and y-positions are plotted for each frame in time at 2 ms resolution (500 frames/s), against the reference frame position, P0(0, 0, 0). A comparable (inverted) atomic force microscopy data (cyan) closely matches the rise-time dynamic of the cross-correlation rhabdomere displacement estimate, validating our analytical approach. The analysis also implies that well dark-adapted photoreceptors may respond weakly to deep-red (740 nm) light onset (black trace 0–100 ms). Note R8 rhabdomere, which lies directly below R7, likely contracts too.
